|
Download Data (XLS File) |
|
||||||||
|
||||||||
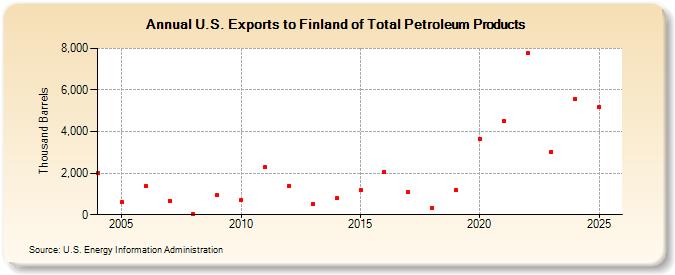
| U.S. Exports to Finland of Total Petroleum Products (Thousand Barrels) | ||||||||
| Decade | Year-0 | Year-1 | Year-2 | Year-3 | Year-4 | Year-5 | Year-6 | Year-7 | Year-8 | Year-9 |
|---|---|---|---|---|---|---|---|---|---|---|
| 2000's | 2,001 | 593 | 1,384 | 672 | 12 | 931 | ||||
| 2010's | 709 | 2,282 | 1,393 | 514 | 794 | 1,186 | 2,062 | 1,079 | 342 | 1,186 |
| 2020's | 3,651 | 4,519 | 7,760 | 3,686 |
| - = No Data Reported; -- = Not Applicable; NA = Not Available; W = Withheld to avoid disclosure of individual company data. |
| Release Date: 3/29/2024 |
| Next Release Date: 8/30/2024 |