|
Download Data (XLS File) |
|
||||||||
|
||||||||
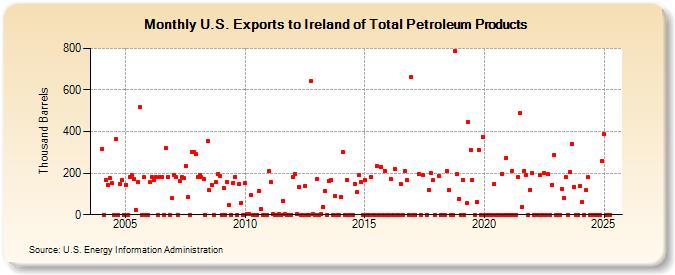
| U.S. Exports to Ireland of Total Petroleum Products (Thousand Barrels) | ||||||||
| Year | Jan | Feb | Mar | Apr | May | Jun | Jul | Aug | Sep | Oct | Nov | Dec |
|---|---|---|---|---|---|---|---|---|---|---|---|---|
| 2004 | 315 | 1 | 167 | 144 | 176 | 152 | 1 | 365 | 0 | 150 | 167 | 1 |
| 2005 | 145 | 1 | 182 | 191 | 174 | 24 | 156 | 516 | 1 | 179 | 0 | 1 |
| 2006 | 156 | 182 | 166 | 180 | 0 | 182 | 179 | 1 | 322 | 182 | 1 | 78 |
| 2007 | 192 | 182 | 1 | 162 | 181 | 175 | 235 | 84 | 1 | 302 | 302 | 290 |
| 2008 | 183 | 193 | 180 | 172 | 1 | 356 | 117 | 143 | 1 | 156 | 194 | 185 |
| 2009 | 1 | 129 | 1 | 157 | 45 | 1 | 154 | 182 | 1 | 150 | 58 | 1 |
| 2010 | 152 | 2 | 5 | 96 | 1 | 1 | 1 | 113 | 26 | 1 | 1 | 0 |
| 2011 | 211 | 156 | 2 | 0 | 1 | 2 | 1 | 64 | 2 | 1 | 1 | 1 |
| 2012 | 180 | 196 | 2 | 133 | 1 | 1 | 139 | 1 | 1 | 644 | 2 | 1 |
| 2013 | 174 | 0 | 2 | 37 | 112 | 1 | 162 | 165 | 0 | 90 | 1 | 0 |
| 2014 | 84 | 300 | 1 | 168 | 1 | 0 | 1 | 149 | 107 | 191 | 155 | 0 |
| 2015 | 168 | 0 | 1 | 180 | 1 | 0 | 234 | 1 | 228 | 1 | 212 | 0 |
| 2016 | 0 | 170 | 1 | 220 | 0 | 0 | 150 | 0 | 212 | 165 | 0 | 660 |
| 2017 | 0 | 1 | 197 | 0 | 189 | 0 | 120 | 200 | 165 | 1 | ||
| 2018 | 188 | 0 | 1 | 0 | 209 | 118 | 0 | 0 | 788 | 194 | 75 | |
| 2019 | 0 | 169 | 0 | 55 | 447 | 313 | 165 | 0 | 63 | 313 | 0 | 376 |
| 2020 | 0 | 0 | 0 | 0 | 0 | 149 | 0 | 0 | 0 | 198 | 0 | 275 |
| 2021 | 0 | 0 | 212 | 1 | 1 | 179 | 491 | 39 | 212 | 190 | 1 | 121 |
| 2022 | 199 | 0 | 0 | 1 | 189 | 0 | 202 | 0 | 194 | 0 | 145 | 289 |
| 2023 | 0 | 1 | 0 | 124 | 80 | 179 | 1 | 205 | 342 | 135 | 1 | 0 |
| 2024 | 138 | 61 | 0 | 117 | 179 | 1 | 0 | 0 | 0 | 0 | 0 | 258 |
| 2025 | 388 | 0 | 0 | 0 | ||||||||
| - = No Data Reported; -- = Not Applicable; NA = Not Available; W = Withheld to avoid disclosure of individual company data. |
| Release Date: 6/30/2025 |
| Next Release Date: 7/31/2025 |