|
Download Data (XLS File) |
|
||||||||
|
||||||||
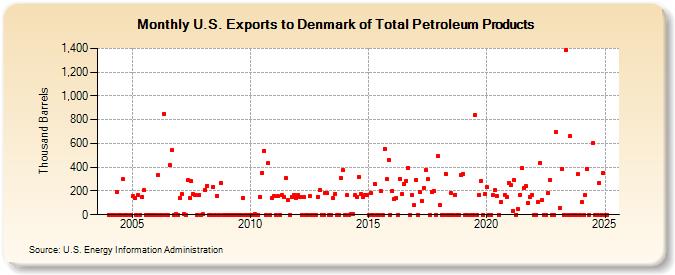
| U.S. Exports to Denmark of Total Petroleum Products (Thousand Barrels) | ||||||||
| Year | Jan | Feb | Mar | Apr | May | Jun | Jul | Aug | Sep | Oct | Nov | Dec |
|---|---|---|---|---|---|---|---|---|---|---|---|---|
| 2004 | 0 | 0 | 0 | 0 | 193 | 0 | 0 | 300 | 1 | 0 | 0 | |
| 2005 | 155 | 141 | 0 | 165 | 0 | 150 | 204 | 0 | 1 | 1 | 1 | 0 |
| 2006 | 0 | 334 | 0 | 0 | 851 | 0 | 0 | 415 | 541 | 0 | 2 | 0 |
| 2007 | 138 | 172 | 2 | 0 | 290 | 137 | 281 | 172 | 166 | 0 | 164 | 1 |
| 2008 | 2 | 212 | 242 | 1 | 0 | 236 | 1 | 160 | 0 | 271 | 0 | 0 |
| 2009 | 0 | 0 | 0 | 0 | 0 | 1 | 0 | 0 | 143 | 0 | 0 | 0 |
| 2010 | 0 | 0 | 2 | 0 | 0 | 152 | 353 | 537 | 1 | 432 | 0 | 144 |
| 2011 | 156 | 0 | 155 | 1 | 165 | 153 | 309 | 120 | 0 | 153 | 170 | 144 |
| 2012 | 164 | 150 | 0 | 152 | 0 | 0 | 155 | 0 | 0 | 1 | 152 | 210 |
| 2013 | 0 | 0 | 182 | 182 | 0 | 0 | 137 | 177 | 0 | 0 | 308 | 374 |
| 2014 | 0 | 165 | 0 | 5 | 5 | 164 | 151 | 321 | 172 | 151 | 163 | 167 |
| 2015 | 0 | 182 | 0 | 259 | 0 | 0 | 198 | 0 | 555 | 300 | 461 | 0 |
| 2016 | 198 | 131 | 140 | 0 | 301 | 177 | 258 | 286 | 393 | 0 | 169 | 79 |
| 2017 | 296 | 1 | 193 | 116 | 224 | 374 | 298 | 0 | 193 | 199 | 0 | 491 |
| 2018 | 85 | 0 | 0 | 345 | 0 | 0 | 179 | 0 | 170 | 0 | 0 | 331 |
| 2019 | 345 | 0 | 0 | 0 | 0 | 841 | 0 | 165 | 286 | 0 | 176 | |
| 2020 | 231 | 0 | 0 | 166 | 204 | 161 | 0 | 110 | 167 | 147 | 271 | |
| 2021 | 251 | 33 | 288 | 0 | 47 | 166 | 391 | 226 | 239 | 98 | 151 | 167 |
| 2022 | 0 | 0 | 107 | 438 | 127 | 0 | 0 | 184 | 293 | 0 | 0 | 694 |
| 2023 | 56 | 388 | 0 | 1,383 | 0 | 660 | 0 | 0 | 0 | 339 | 0 | |
| 2024 | 107 | |||||||||||
| - = No Data Reported; -- = Not Applicable; NA = Not Available; W = Withheld to avoid disclosure of individual company data. |
| Release Date: 3/29/2024 |
| Next Release Date: 4/30/2024 |