|
Download Data (XLS File) |
|
||||||||
|
||||||||
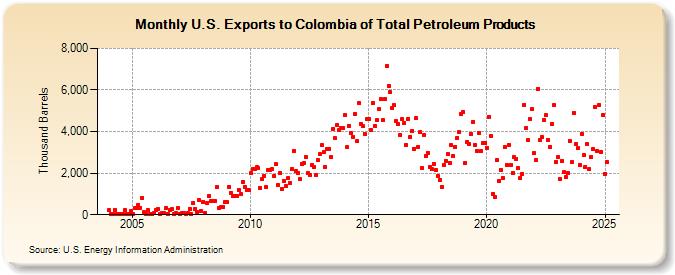
| U.S. Exports to Colombia of Total Petroleum Products (Thousand Barrels) | ||||||||
| Year | Jan | Feb | Mar | Apr | May | Jun | Jul | Aug | Sep | Oct | Nov | Dec |
|---|---|---|---|---|---|---|---|---|---|---|---|---|
| 2004 | 210 | 30 | 43 | 221 | 44 | 52 | 22 | 50 | 207 | 34 | 34 | 179 |
| 2005 | 42 | 300 | 330 | 461 | 339 | 821 | 115 | 41 | 208 | 28 | 13 | 72 |
| 2006 | 226 | 284 | 46 | 83 | 78 | 327 | 54 | 220 | 259 | 24 | 77 | 344 |
| 2007 | 35 | 82 | 69 | 53 | 60 | 280 | 11 | 556 | 280 | 111 | 716 | 187 |
| 2008 | 624 | 91 | 581 | 894 | 674 | 680 | 660 | 1,341 | 338 | 354 | 371 | 622 |
| 2009 | 614 | 1,351 | 1,046 | 918 | 903 | 916 | 1,204 | 974 | 1,581 | 1,344 | 1,188 | 1,204 |
| 2010 | 1,984 | 2,202 | 2,175 | 2,282 | 2,270 | 1,270 | 1,713 | 1,852 | 1,332 | 2,130 | 2,164 | 2,195 |
| 2011 | 1,866 | 2,418 | 1,412 | 2,005 | 1,253 | 1,611 | 1,395 | 1,759 | 1,533 | 2,206 | 3,074 | 2,107 |
| 2012 | 2,011 | 1,712 | 2,452 | 2,496 | 2,767 | 1,995 | 1,916 | 2,376 | 2,285 | 1,897 | 2,640 | 2,901 |
| 2013 | 3,336 | 2,997 | 2,309 | 3,177 | 3,177 | 2,771 | 4,141 | 3,673 | 4,323 | 4,084 | 4,174 | 4,192 |
| 2014 | 4,781 | 3,238 | 4,287 | 3,917 | 3,762 | 4,842 | 3,545 | 5,367 | 4,366 | 4,254 | 3,872 | 4,599 |
| 2015 | 4,626 | 4,064 | 5,365 | 4,273 | 4,556 | 5,064 | 5,563 | 4,551 | 5,558 | 7,151 | 6,180 | 5,890 |
| 2016 | 5,128 | 5,274 | 4,516 | 4,341 | 3,836 | 4,593 | 4,402 | 3,355 | 4,616 | 3,759 | 4,038 | 3,174 |
| 2017 | 4,649 | 3,274 | 3,977 | 2,270 | 3,856 | 2,831 | 2,988 | 2,306 | 2,196 | 2,453 | 2,133 | 1,869 |
| 2018 | 1,690 | 1,345 | 2,412 | 2,600 | 2,930 | 2,508 | 3,332 | 2,819 | 3,259 | 3,707 | 3,970 | 4,862 |
| 2019 | 4,951 | 2,507 | 3,486 | 3,380 | 3,889 | 4,476 | 3,371 | 3,054 | 3,951 | 3,057 | 3,429 | 3,446 |
| 2020 | 3,219 | 4,721 | 3,775 | 997 | 830 | 2,617 | 1,627 | 2,161 | 1,767 | 3,235 | 2,413 | 3,368 |
| 2021 | 2,388 | 2,015 | 2,759 | 2,691 | 2,232 | 1,785 | 1,980 | 5,293 | 4,177 | 3,571 | 4,612 | 5,079 |
| 2022 | 2,973 | 2,625 | 6,060 | 3,603 | 3,729 | 4,544 | 4,774 | 3,571 | 3,280 | 4,367 | 5,254 | 2,558 |
| 2023 | 2,616 | 1,402 | 2,608 | 2,142 | 883 | 2,309 | 3,582 | 2,502 | 4,908 | 3,388 | 2,986 | 2,213 |
| 2024 | 3,895 | |||||||||||
| - = No Data Reported; -- = Not Applicable; NA = Not Available; W = Withheld to avoid disclosure of individual company data. |
| Release Date: 3/29/2024 |
| Next Release Date: 4/30/2024 |