|
Download Data (XLS File) |
|
||||||||
|
||||||||
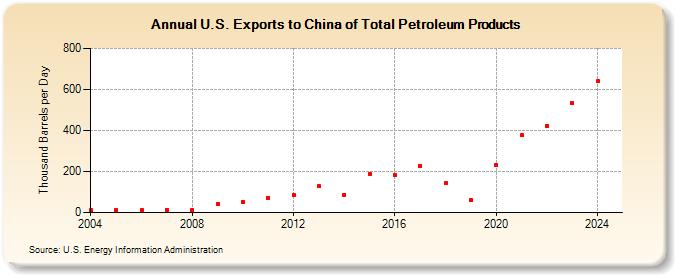
| U.S. Exports to China of Total Petroleum Products (Thousand Barrels per Day) | ||||||||
| Decade | Year-0 | Year-1 | Year-2 | Year-3 | Year-4 | Year-5 | Year-6 | Year-7 | Year-8 | Year-9 |
|---|---|---|---|---|---|---|---|---|---|---|
| 2000's | 11 | 11 | 11 | 14 | 13 | 44 | ||||
| 2010's | 52 | 73 | 85 | 128 | 88 | 190 | 181 | 226 | 143 | 59 |
| 2020's | 234 | 376 | 424 | 525 |
| - = No Data Reported; -- = Not Applicable; NA = Not Available; W = Withheld to avoid disclosure of individual company data. |
| Release Date: 3/29/2024 |
| Next Release Date: 8/30/2024 |