|
Download Data (XLS File) |
|
||||||||
|
||||||||
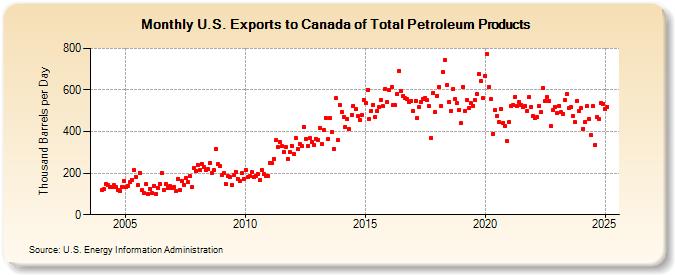
| U.S. Exports to Canada of Total Petroleum Products (Thousand Barrels per Day) | ||||||||
| Year | Jan | Feb | Mar | Apr | May | Jun | Jul | Aug | Sep | Oct | Nov | Dec |
|---|---|---|---|---|---|---|---|---|---|---|---|---|
| 2004 | 119 | 123 | 147 | 142 | 133 | 133 | 141 | 134 | 119 | 114 | 134 | 161 |
| 2005 | 133 | 140 | 156 | 169 | 215 | 183 | 141 | 200 | 117 | 105 | 146 | 100 |
| 2006 | 124 | 103 | 140 | 99 | 130 | 150 | 200 | 118 | 148 | 130 | 136 | 130 |
| 2007 | 134 | 115 | 172 | 121 | 163 | 145 | 176 | 158 | 185 | 131 | 226 | 208 |
| 2008 | 239 | 214 | 246 | 230 | 217 | 218 | 247 | 203 | 214 | 316 | 242 | 233 |
| 2009 | 191 | 199 | 148 | 185 | 179 | 144 | 190 | 207 | 173 | 160 | 199 | 174 |
| 2010 | 216 | 182 | 184 | 205 | 179 | 188 | 196 | 167 | 217 | 194 | 187 | 186 |
| 2011 | 250 | 247 | 269 | 358 | 326 | 351 | 329 | 303 | 325 | 270 | 302 | 332 |
| 2012 | 294 | 369 | 314 | 341 | 331 | 423 | 365 | 332 | 367 | 351 | 335 | 365 |
| 2013 | 360 | 417 | 339 | 407 | 467 | 362 | 464 | 396 | 317 | 559 | 359 | 528 |
| 2014 | 495 | 472 | 422 | 462 | 411 | 480 | 523 | 510 | 473 | 455 | 479 | 554 |
| 2015 | 537 | 602 | 461 | 501 | 529 | 470 | 500 | 516 | 553 | 521 | 607 | 544 |
| 2016 | 600 | 615 | 526 | 526 | 580 | 693 | 596 | 571 | 560 | 555 | 541 | 549 |
| 2017 | 500 | 549 | 464 | 519 | 544 | 555 | 563 | 550 | 521 | 369 | 587 | 495 |
| 2018 | 571 | 616 | 522 | 685 | 744 | 625 | 543 | 501 | 604 | 555 | 535 | 503 |
| 2019 | 441 | 616 | 500 | 551 | 515 | 536 | 523 | 551 | 580 | 677 | 642 | 559 |
| 2020 | 669 | 774 | 616 | 556 | 389 | 502 | 474 | 447 | 509 | 443 | 429 | 353 |
| 2021 | 446 | 523 | 529 | 568 | 524 | 543 | 529 | 518 | 522 | 500 | 566 | 517 |
| 2022 | 475 | 464 | 468 | 525 | 494 | 610 | 548 | 566 | 547 | 426 | 505 | 520 |
| 2023 | 482 | 503 | 491 | 482 | 425 | 470 | 447 | 426 | 397 | 368 | 548 | 493 |
| 2024 | 511 | 414 | 447 | 521 | ||||||||
| - = No Data Reported; -- = Not Applicable; NA = Not Available; W = Withheld to avoid disclosure of individual company data. |
| Release Date: 6/28/2024 |
| Next Release Date: 7/31/2024 |