|
Download Data (XLS File) |
|
||||||||
|
||||||||
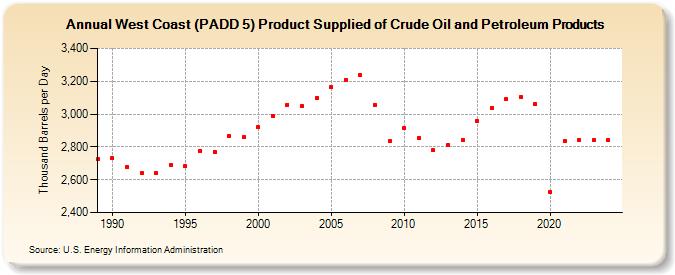
| West Coast (PADD 5) Product Supplied of Crude Oil and Petroleum Products (Thousand Barrels per Day) | ||||||||
| Decade | Year-0 | Year-1 | Year-2 | Year-3 | Year-4 | Year-5 | Year-6 | Year-7 | Year-8 | Year-9 |
|---|---|---|---|---|---|---|---|---|---|---|
| 1980's | 2,724 | |||||||||
| 1990's | 2,731 | 2,679 | 2,639 | 2,638 | 2,690 | 2,681 | 2,776 | 2,771 | 2,868 | 2,861 |
| 2000's | 2,919 | 2,991 | 3,057 | 3,049 | 3,098 | 3,162 | 3,210 | 3,235 | 3,057 | 2,834 |
| 2010's | 2,914 | 2,854 | 2,779 | 2,813 | 2,841 | 2,959 | 3,038 | 3,089 | 3,105 | 3,061 |
| 2020's | 2,524 | 2,835 | 2,842 | 2,842 |
| - = No Data Reported; -- = Not Applicable; NA = Not Available; W = Withheld to avoid disclosure of individual company data. |
| Release Date: 3/29/2024 |
| Next Release Date: 8/30/2024 |