|
Download Data (XLS File) |
|
||||||||
|
||||||||
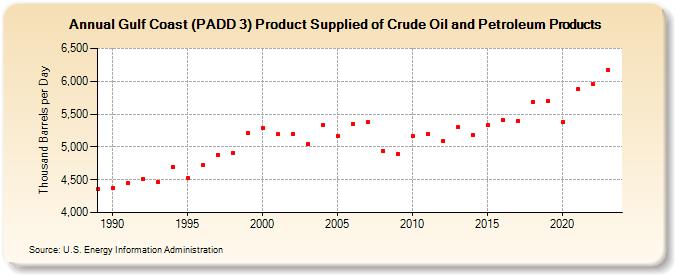
| Gulf Coast (PADD 3) Product Supplied of Crude Oil and Petroleum Products (Thousand Barrels per Day) | ||||||||
| Decade | Year-0 | Year-1 | Year-2 | Year-3 | Year-4 | Year-5 | Year-6 | Year-7 | Year-8 | Year-9 |
|---|---|---|---|---|---|---|---|---|---|---|
| 1980's | 4,357 | |||||||||
| 1990's | 4,380 | 4,445 | 4,513 | 4,463 | 4,690 | 4,521 | 4,718 | 4,884 | 4,911 | 5,217 |
| 2000's | 5,288 | 5,189 | 5,198 | 5,041 | 5,336 | 5,167 | 5,351 | 5,380 | 4,937 | 4,899 |
| 2010's | 5,165 | 5,197 | 5,089 | 5,299 | 5,186 | 5,335 | 5,413 | 5,401 | 5,681 | 5,697 |
| 2020's | 5,378 | 5,874 | 5,956 | 6,171 |
| - = No Data Reported; -- = Not Applicable; NA = Not Available; W = Withheld to avoid disclosure of individual company data. |
| Release Date: 3/29/2024 |
| Next Release Date: 8/30/2024 |