|
Download Data (XLS File) |
|
||||||||
|
||||||||
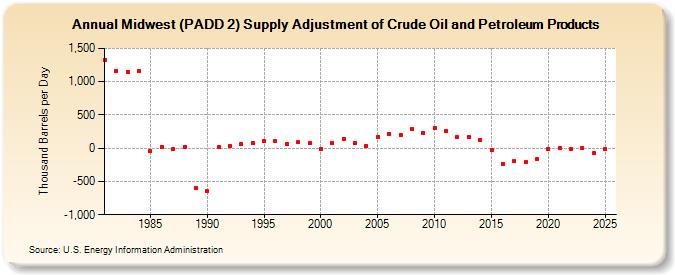
| Midwest (PADD 2) Supply Adjustment of Crude Oil and Petroleum Products (Thousand Barrels per Day) | ||||||||
| Decade | Year-0 | Year-1 | Year-2 | Year-3 | Year-4 | Year-5 | Year-6 | Year-7 | Year-8 | Year-9 |
|---|---|---|---|---|---|---|---|---|---|---|
| 1980's | 1,328 | 1,163 | 1,150 | 1,166 | -45 | 24 | -9 | 18 | -600 | |
| 1990's | -644 | 11 | 36 | 58 | 79 | 113 | 103 | 65 | 86 | 79 |
| 2000's | -5 | 81 | 143 | 77 | 35 | 171 | 212 | 202 | 292 | 221 |
| 2010's | 304 | 262 | 161 | 161 | 124 | -21 | -239 | -196 | -204 | -168 |
| 2020's | -11 | 0 | -6 | -33 |
| - = No Data Reported; -- = Not Applicable; NA = Not Available; W = Withheld to avoid disclosure of individual company data. |
| Release Date: 3/29/2024 |
| Next Release Date: 8/30/2024 |