|
Download Data (XLS File) |
|
||||||||
|
||||||||
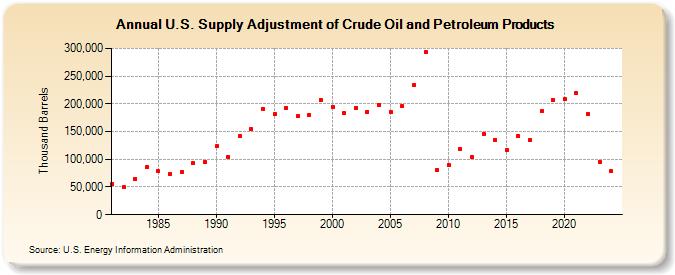
| U.S. Supply Adjustment of Crude Oil and Petroleum Products (Thousand Barrels) | ||||||||
| Decade | Year-0 | Year-1 | Year-2 | Year-3 | Year-4 | Year-5 | Year-6 | Year-7 | Year-8 | Year-9 |
|---|---|---|---|---|---|---|---|---|---|---|
| 1980's | 55,273 | 49,148 | 64,974 | 85,451 | 78,268 | 73,518 | 77,780 | 92,680 | 94,975 | |
| 1990's | 123,245 | 104,805 | 141,417 | 153,918 | 190,978 | 181,186 | 193,114 | 177,867 | 180,718 | 207,125 |
| 2000's | 194,821 | 182,824 | 192,955 | 185,784 | 198,393 | 185,649 | 196,080 | 233,648 | 294,062 | 80,586 |
| 2010's | 89,905 | 118,624 | 104,475 | 146,162 | 135,492 | 117,043 | 141,562 | 134,391 | 187,440 | 207,653 |
| 2020's | 207,900 | 219,149 | 182,179 | 95,877 |
| - = No Data Reported; -- = Not Applicable; NA = Not Available; W = Withheld to avoid disclosure of individual company data. |
| Release Date: 8/30/2024 |
| Next Release Date: 8/29/2025 |