|
Download Data (XLS File) |
|
||||||||
|
||||||||
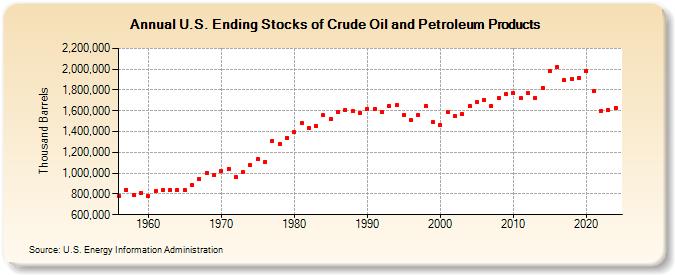
| U.S. Ending Stocks of Crude Oil and Petroleum Products (Thousand Barrels) | ||||||||
| Decade | Year-0 | Year-1 | Year-2 | Year-3 | Year-4 | Year-5 | Year-6 | Year-7 | Year-8 | Year-9 |
|---|---|---|---|---|---|---|---|---|---|---|
| 1950's | 780,391 | 841,317 | 788,796 | 808,042 | ||||||
| 1960's | 778,735 | 825,074 | 834,296 | 835,559 | 839,235 | 836,344 | 881,105 | 944,111 | 997,572 | 980,123 |
| 1970's | 1,017,861 | 1,043,947 | 958,979 | 1,008,307 | 1,073,646 | 1,132,955 | 1,111,810 | 1,311,900 | 1,277,619 | 1,340,862 |
| 1980's | 1,392,228 | 1,483,648 | 1,429,924 | 1,453,637 | 1,556,227 | 1,518,769 | 1,592,512 | 1,607,451 | 1,597,232 | 1,581,419 |
| 1990's | 1,620,633 | 1,616,954 | 1,591,974 | 1,647,219 | 1,652,785 | 1,562,852 | 1,507,416 | 1,559,759 | 1,646,975 | 1,492,931 |
| 2000's | 1,467,547 | 1,586,349 | 1,547,910 | 1,568,303 | 1,644,805 | 1,681,551 | 1,703,049 | 1,647,633 | 1,719,144 | 1,758,336 |
| 2010's | 1,769,603 | 1,719,578 | 1,774,903 | 1,724,360 | 1,821,776 | 1,979,043 | 2,024,886 | 1,892,001 | 1,908,077 | 1,916,847 |
| 2020's | 1,981,434 | 1,792,294 | 1,594,622 | 1,606,901 |
| - = No Data Reported; -- = Not Applicable; NA = Not Available; W = Withheld to avoid disclosure of individual company data. |
| Release Date: 3/29/2024 |
| Next Release Date: 8/30/2024 |