|
Download Data (XLS File) |
|
||||||||
|
||||||||
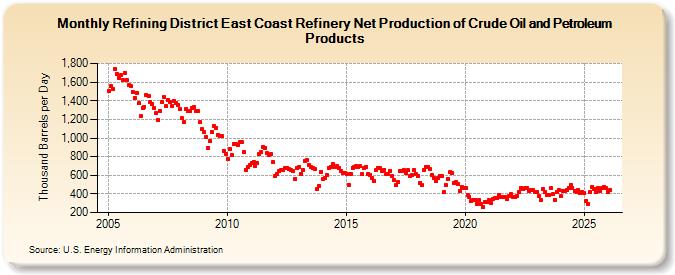
| Refining District East Coast Refinery Net Production of Crude Oil and Petroleum Products (Thousand Barrels per Day) | ||||||||
| Year | Jan | Feb | Mar | Apr | May | Jun | Jul | Aug | Sep | Oct | Nov | Dec |
|---|---|---|---|---|---|---|---|---|---|---|---|---|
| 2005 | 1,506 | 1,555 | 1,522 | 1,742 | 1,692 | 1,646 | 1,672 | 1,624 | 1,703 | 1,621 | 1,564 | 1,553 |
| 2006 | 1,493 | 1,430 | 1,485 | 1,373 | 1,233 | 1,326 | 1,337 | 1,463 | 1,455 | 1,382 | 1,369 | 1,322 |
| 2007 | 1,267 | 1,191 | 1,286 | 1,387 | 1,440 | 1,340 | 1,409 | 1,389 | 1,345 | 1,401 | 1,373 | 1,356 |
| 2008 | 1,307 | 1,210 | 1,172 | 1,311 | 1,286 | 1,289 | 1,322 | 1,334 | 1,291 | 1,288 | 1,168 | 1,092 |
| 2009 | 1,066 | 1,012 | 897 | 967 | 1,065 | 1,132 | 1,105 | 1,036 | 1,022 | 1,020 | 862 | 824 |
| 2010 | 775 | 877 | 817 | 938 | 932 | 923 | 959 | 956 | 845 | 661 | 686 | 710 |
| 2011 | 734 | 746 | 698 | 731 | 825 | 847 | 907 | 896 | 835 | 820 | 827 | 738 |
| 2012 | 593 | 617 | 641 | 652 | 656 | 678 | 681 | 667 | 655 | 644 | 565 | 677 |
| 2013 | 693 | 616 | 661 | 757 | 766 | 713 | 690 | 674 | 663 | 450 | 488 | 639 |
| 2014 | 559 | 572 | 600 | 683 | 690 | 722 | 692 | 696 | 682 | 651 | 626 | 629 |
| 2015 | 611 | 499 | 618 | 679 | 690 | 702 | 692 | 696 | 615 | 678 | 690 | 617 |
| 2016 | 602 | 568 | 538 | 656 | 678 | 674 | 645 | 661 | 618 | 619 | 649 | 592 |
| 2017 | 551 | 497 | 527 | 647 | 649 | 659 | 626 | 653 | 593 | 602 | 657 | 619 |
| 2018 | 596 | 522 | 493 | 661 | 690 | 684 | 670 | 608 | 573 | 541 | 572 | 595 |
| 2019 | 590 | 417 | 494 | 564 | 630 | 625 | 522 | 523 | 505 | 431 | 473 | 466 |
| 2020 | 459 | 389 | 366 | 327 | 340 | 335 | 296 | 333 | 291 | 256 | 314 | 311 |
| 2021 | 333 | 306 | 343 | 355 | 359 | 392 | 369 | 371 | 368 | 341 | 381 | 396 |
| 2022 | 372 | 368 | 382 | 426 | 464 | 452 | 460 | 466 | 429 | 439 | 447 | 421 |
| 2023 | 425 | 377 | 335 | 454 | 423 | 386 | 388 | 463 | 395 | 334 | 421 | 442 |
| 2024 | 373 | |||||||||||
| - = No Data Reported; -- = Not Applicable; NA = Not Available; W = Withheld to avoid disclosure of individual company data. |
| Release Date: 3/29/2024 |
| Next Release Date: 4/30/2024 |