|
Download Data (XLS File) |
|
||||||||
|
||||||||
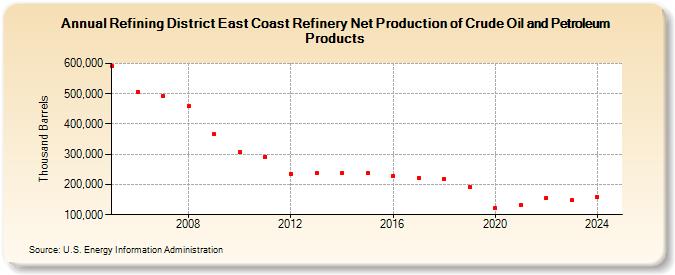
| Refining District East Coast Refinery Net Production of Crude Oil and Petroleum Products (Thousand Barrels) | ||||||||
| Decade | Year-0 | Year-1 | Year-2 | Year-3 | Year-4 | Year-5 | Year-6 | Year-7 | Year-8 | Year-9 |
|---|---|---|---|---|---|---|---|---|---|---|
| 2000's | 590,145 | 506,847 | 492,643 | 459,643 | 365,310 | |||||
| 2010's | 306,454 | 292,247 | 235,756 | 237,628 | 237,448 | 237,221 | 228,737 | 221,603 | 219,289 | 190,028 |
| 2020's | 122,462 | 131,361 | 156,013 | 147,361 |
| - = No Data Reported; -- = Not Applicable; NA = Not Available; W = Withheld to avoid disclosure of individual company data. |
| Release Date: 4/30/2024 |
| Next Release Date: 8/30/2024 |