|
Download Data (XLS File) |
|
||||||||
|
||||||||
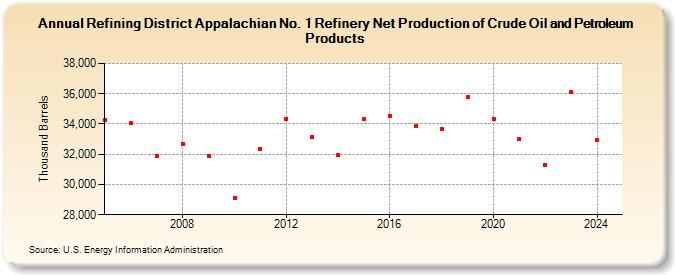
| Refining District Appalachian No. 1 Refinery Net Production of Crude Oil and Petroleum Products (Thousand Barrels) | ||||||||
| Decade | Year-0 | Year-1 | Year-2 | Year-3 | Year-4 | Year-5 | Year-6 | Year-7 | Year-8 | Year-9 |
|---|---|---|---|---|---|---|---|---|---|---|
| 2000's | 34,258 | 34,074 | 31,898 | 32,682 | 31,890 | |||||
| 2010's | 29,084 | 32,354 | 34,359 | 33,114 | 31,979 | 34,353 | 34,553 | 33,885 | 33,692 | 35,791 |
| 2020's | 34,323 | 33,005 | 31,279 | 36,099 |
| - = No Data Reported; -- = Not Applicable; NA = Not Available; W = Withheld to avoid disclosure of individual company data. |
| Release Date: 3/29/2024 |
| Next Release Date: 8/30/2024 |