|
Download Data (XLS File) |
|
||||||||
|
||||||||
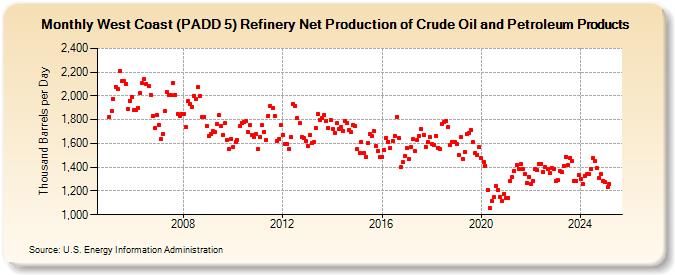
| West Coast (PADD 5) Refinery Net Production of Crude Oil and Petroleum Products (Thousand Barrels per Day) | ||||||||
| Year | Jan | Feb | Mar | Apr | May | Jun | Jul | Aug | Sep | Oct | Nov | Dec |
|---|---|---|---|---|---|---|---|---|---|---|---|---|
| 2005 | 1,825 | 1,870 | 1,976 | 2,074 | 2,060 | 2,209 | 2,125 | 2,127 | 2,104 | 1,889 | 1,960 | 1,993 |
| 2006 | 1,884 | 1,884 | 1,902 | 2,025 | 2,105 | 2,139 | 2,098 | 2,087 | 2,007 | 1,834 | 1,729 | 1,840 |
| 2007 | 1,756 | 1,634 | 1,679 | 1,869 | 2,036 | 2,004 | 2,004 | 2,109 | 2,011 | 1,848 | 1,835 | 1,850 |
| 2008 | 1,850 | 1,736 | 1,955 | 1,932 | 1,909 | 2,002 | 1,970 | 2,071 | 1,996 | 1,823 | 1,825 | 1,748 |
| 2009 | 1,663 | 1,682 | 1,706 | 1,694 | 1,767 | 1,836 | 1,743 | 1,674 | 1,771 | 1,633 | 1,551 | 1,640 |
| 2010 | 1,570 | 1,616 | 1,625 | 1,743 | 1,771 | 1,782 | 1,785 | 1,700 | 1,752 | 1,671 | 1,656 | 1,682 |
| 2011 | 1,550 | 1,655 | 1,752 | 1,698 | 1,633 | 1,833 | 1,915 | 1,900 | 1,831 | 1,621 | 1,640 | 1,751 |
| 2012 | 1,674 | 1,596 | 1,596 | 1,553 | 1,655 | 1,929 | 1,918 | 1,810 | 1,769 | 1,655 | 1,642 | 1,621 |
| 2013 | 1,578 | 1,669 | 1,605 | 1,613 | 1,732 | 1,846 | 1,799 | 1,811 | 1,842 | 1,790 | 1,730 | 1,794 |
| 2014 | 1,721 | 1,692 | 1,776 | 1,722 | 1,738 | 1,705 | 1,792 | 1,774 | 1,713 | 1,693 | 1,759 | 1,743 |
| 2015 | 1,549 | 1,519 | 1,616 | 1,519 | 1,486 | 1,605 | 1,676 | 1,662 | 1,702 | 1,578 | 1,536 | 1,483 |
| 2016 | 1,486 | 1,542 | 1,648 | 1,615 | 1,563 | 1,624 | 1,666 | 1,822 | 1,645 | 1,399 | 1,441 | 1,491 |
| 2017 | 1,558 | 1,472 | 1,566 | 1,635 | 1,535 | 1,629 | 1,663 | 1,720 | 1,674 | 1,574 | 1,609 | 1,658 |
| 2018 | 1,594 | 1,585 | 1,664 | 1,564 | 1,556 | 1,765 | 1,784 | 1,787 | 1,736 | 1,585 | 1,615 | 1,610 |
| 2019 | 1,592 | 1,502 | 1,653 | 1,471 | 1,529 | 1,676 | 1,688 | 1,711 | 1,612 | 1,523 | 1,506 | 1,569 |
| 2020 | 1,475 | 1,446 | 1,411 | 1,212 | 1,057 | 1,117 | 1,145 | 1,240 | 1,206 | 1,150 | 1,116 | 1,177 |
| 2021 | 1,142 | 1,144 | 1,286 | 1,318 | 1,371 | 1,415 | 1,388 | 1,424 | 1,389 | 1,345 | 1,265 | 1,320 |
| 2022 | 1,261 | 1,282 | 1,388 | 1,376 | 1,424 | 1,429 | 1,358 | 1,403 | 1,383 | 1,347 | 1,397 | 1,384 |
| 2023 | 1,285 | 1,289 | 1,366 | 1,356 | 1,413 | 1,489 | 1,416 | 1,481 | 1,454 | 1,283 | 1,286 | 1,335 |
| 2024 | 1,300 | |||||||||||
| - = No Data Reported; -- = Not Applicable; NA = Not Available; W = Withheld to avoid disclosure of individual company data. |
| Release Date: 3/29/2024 |
| Next Release Date: 4/30/2024 |