|
Download Data (XLS File) |
|
||||||||
|
||||||||
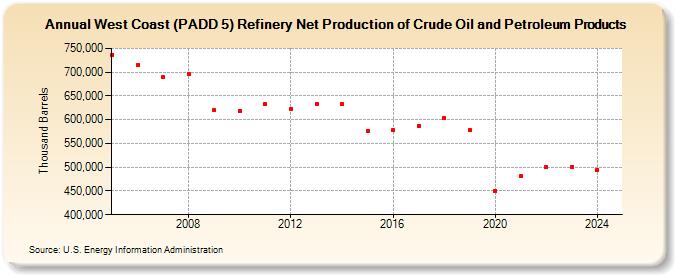
| West Coast (PADD 5) Refinery Net Production of Crude Oil and Petroleum Products (Thousand Barrels) | ||||||||
| Decade | Year-0 | Year-1 | Year-2 | Year-3 | Year-4 | Year-5 | Year-6 | Year-7 | Year-8 | Year-9 |
|---|---|---|---|---|---|---|---|---|---|---|
| 2000's | 736,600 | 715,932 | 689,056 | 696,101 | 619,331 | |||||
| 2010's | 619,187 | 632,209 | 622,829 | 633,031 | 633,704 | 575,936 | 577,781 | 587,045 | 603,724 | 579,204 |
| 2020's | 449,776 | 481,189 | 499,973 | 500,502 | 494,684 |
| - = No Data Reported; -- = Not Applicable; NA = Not Available; W = Withheld to avoid disclosure of individual company data. |
| Release Date: 6/30/2025 |
| Next Release Date: 8/29/2025 |