|
Download Data (XLS File) |
|
||||||||
|
||||||||
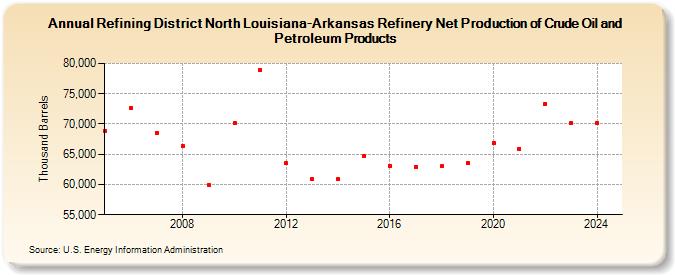
| Refining District North Louisiana-Arkansas Refinery Net Production of Crude Oil and Petroleum Products (Thousand Barrels) | ||||||||
| Decade | Year-0 | Year-1 | Year-2 | Year-3 | Year-4 | Year-5 | Year-6 | Year-7 | Year-8 | Year-9 |
|---|---|---|---|---|---|---|---|---|---|---|
| 2000's | 68,879 | 72,683 | 68,567 | 66,394 | 59,943 | |||||
| 2010's | 70,212 | 78,947 | 63,493 | 60,834 | 60,885 | 64,630 | 63,107 | 62,921 | 63,009 | 63,582 |
| 2020's | 66,876 | 65,939 | 73,368 | 70,075 |
| - = No Data Reported; -- = Not Applicable; NA = Not Available; W = Withheld to avoid disclosure of individual company data. |
| Release Date: 3/29/2024 |
| Next Release Date: 8/30/2024 |