|
Download Data (XLS File) |
|
||||||||
|
||||||||
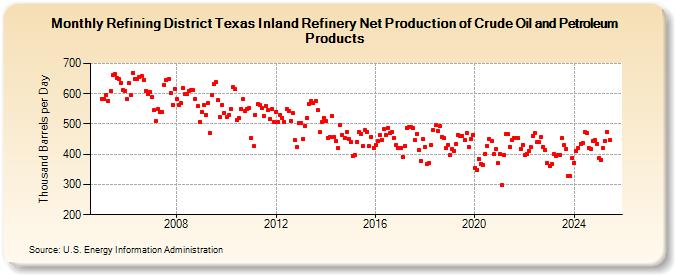
| Refining District Texas Inland Refinery Net Production of Crude Oil and Petroleum Products (Thousand Barrels per Day) | ||||||||
| Year | Jan | Feb | Mar | Apr | May | Jun | Jul | Aug | Sep | Oct | Nov | Dec |
|---|---|---|---|---|---|---|---|---|---|---|---|---|
| 2005 | 583 | 582 | 597 | 576 | 609 | 661 | 665 | 653 | 649 | 637 | 613 | 610 |
| 2006 | 581 | 634 | 595 | 670 | 650 | 649 | 654 | 657 | 645 | 609 | 600 | 607 |
| 2007 | 589 | 545 | 510 | 549 | 540 | 540 | 630 | 645 | 649 | 603 | 563 | 617 |
| 2008 | 582 | 562 | 569 | 620 | 599 | 598 | 610 | 613 | 611 | 584 | 558 | 507 |
| 2009 | 540 | 562 | 530 | 568 | 470 | 597 | 633 | 638 | 579 | 522 | 563 | 537 |
| 2010 | 522 | 529 | 549 | 622 | 614 | 512 | 519 | 551 | 581 | 542 | 548 | 553 |
| 2011 | 454 | 426 | 530 | 566 | 564 | 553 | 528 | 561 | 546 | 516 | 549 | 508 |
| 2012 | 541 | 507 | 530 | 519 | 505 | 550 | 544 | 511 | 535 | 446 | 423 | 504 |
| 2013 | 504 | 451 | 493 | 520 | 565 | 576 | 569 | 577 | 545 | 472 | 507 | 521 |
| 2014 | 509 | 455 | 457 | 526 | 458 | 444 | 422 | 497 | 463 | 454 | 475 | 451 |
| 2015 | 439 | 393 | 399 | 442 | 475 | 468 | 427 | 479 | 473 | 426 | 457 | 422 |
| 2016 | 430 | 443 | 463 | 448 | 483 | 464 | 488 | 470 | 472 | 455 | 430 | 422 |
| 2017 | 422 | 391 | 427 | 487 | 489 | 491 | 487 | 447 | 468 | 413 | 378 | 450 |
| 2018 | 423 | 368 | 371 | 431 | 479 | 495 | 476 | 492 | 458 | 453 | 422 | 432 |
| 2019 | 397 | 416 | 412 | 434 | 465 | 460 | 461 | 446 | 471 | 424 | 451 | 462 |
| 2020 | 356 | 348 | 385 | 369 | 365 | 402 | 427 | 449 | 445 | 400 | 416 | 370 |
| 2021 | 400 | 297 | 397 | 466 | 467 | 424 | 447 | 454 | 454 | 453 | 418 | 431 |
| 2022 | 397 | 402 | 411 | 424 | 461 | 470 | 440 | 439 | 456 | 424 | 414 | 371 |
| 2023 | 360 | 369 | 401 | 395 | 396 | 399 | 452 | 429 | 418 | 329 | 328 | 388 |
| 2024 | 372 | 409 | 423 | 434 | 437 | 473 | ||||||
| - = No Data Reported; -- = Not Applicable; NA = Not Available; W = Withheld to avoid disclosure of individual company data. |
| Release Date: 8/30/2024 |
| Next Release Date: 9/30/2024 |