|
Download Data (XLS File) |
|
||||||||
|
||||||||
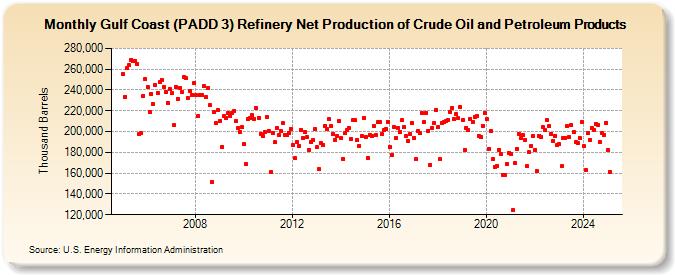
| Gulf Coast (PADD 3) Refinery Net Production of Crude Oil and Petroleum Products (Thousand Barrels) | ||||||||
| Year | Jan | Feb | Mar | Apr | May | Jun | Jul | Aug | Sep | Oct | Nov | Dec |
|---|---|---|---|---|---|---|---|---|---|---|---|---|
| 2005 | 255,088 | 233,345 | 260,738 | 263,850 | 269,177 | 268,247 | 267,917 | 265,021 | 197,385 | 198,389 | 234,339 | 250,373 |
| 2006 | 242,868 | 218,864 | 236,219 | 226,123 | 244,523 | 236,872 | 247,666 | 250,005 | 243,196 | 238,145 | 227,846 | 241,152 |
| 2007 | 236,820 | 206,010 | 243,113 | 231,717 | 242,156 | 238,149 | 252,156 | 251,097 | 232,090 | 239,050 | 235,533 | 246,418 |
| 2008 | 235,307 | 214,690 | 235,338 | 234,914 | 243,397 | 233,318 | 241,426 | 225,078 | 151,880 | 218,363 | 207,913 | 220,847 |
| 2009 | 210,497 | 185,223 | 214,895 | 213,430 | 217,941 | 215,102 | 218,327 | 219,945 | 209,738 | 203,548 | 199,534 | 203,968 |
| 2010 | 187,821 | 168,535 | 212,484 | 213,338 | 215,557 | 212,139 | 222,361 | 213,390 | 197,819 | 195,814 | 199,190 | 214,213 |
| 2011 | 200,741 | 160,817 | 198,692 | 189,618 | 203,426 | 196,568 | 200,709 | 207,984 | 197,002 | 196,376 | 198,700 | 202,912 |
| 2012 | 187,147 | 174,379 | 190,089 | 186,215 | 201,531 | 194,203 | 199,680 | 194,750 | 182,155 | 189,746 | 191,646 | 202,082 |
| 2013 | 184,880 | 163,521 | 188,771 | 187,118 | 205,568 | 201,987 | 212,264 | 205,203 | 197,476 | 192,011 | 195,796 | 209,867 |
| 2014 | 193,396 | 173,370 | 198,184 | 201,138 | 203,071 | 192,761 | 210,654 | 210,703 | 191,472 | 186,102 | 195,929 | 213,487 |
| 2015 | 194,655 | 174,581 | 197,015 | 195,972 | 205,411 | 196,521 | 208,875 | 209,040 | 197,412 | 201,612 | 202,490 | 209,271 |
| 2016 | 185,124 | 177,540 | 204,449 | 193,648 | 203,854 | 199,523 | 210,669 | 204,343 | 195,590 | 191,283 | 197,599 | 208,448 |
| 2017 | 193,853 | 173,583 | 200,450 | 198,224 | 217,715 | 209,388 | 218,259 | 200,909 | 167,855 | 203,816 | 208,273 | 220,610 |
| 2018 | 204,431 | 173,255 | 208,208 | 209,637 | 210,396 | 211,242 | 218,349 | 222,981 | 211,720 | 216,774 | 212,577 | 223,507 |
| 2019 | 211,138 | 182,554 | 203,798 | 201,369 | 211,632 | 209,169 | 214,429 | 215,121 | 196,180 | 194,385 | 205,793 | 218,073 |
| 2020 | 211,772 | 183,369 | 200,944 | 173,195 | 165,718 | 167,067 | 182,304 | 177,996 | 158,329 | 158,561 | 169,186 | 179,760 |
| 2021 | 178,640 | 124,162 | 169,779 | 183,680 | 198,051 | 193,689 | 196,434 | 191,684 | 166,695 | 179,858 | 186,139 | 195,446 |
| 2022 | 182,557 | 161,689 | 196,029 | 195,029 | 204,316 | 201,274 | 210,762 | 205,279 | 197,919 | 190,816 | 195,850 | 186,994 |
| 2023 | 187,667 | 166,284 | 193,740 | 194,412 | 205,841 | 194,708 | 206,347 | 199,780 | 190,037 | 188,897 | 194,436 | 209,055 |
| 2024 | 185,933 | 162,789 | 198,512 | 192,301 | ||||||||
| - = No Data Reported; -- = Not Applicable; NA = Not Available; W = Withheld to avoid disclosure of individual company data. |
| Release Date: 6/28/2024 |
| Next Release Date: 7/31/2024 |