|
Download Data (XLS File) |
|
||||||||
|
||||||||
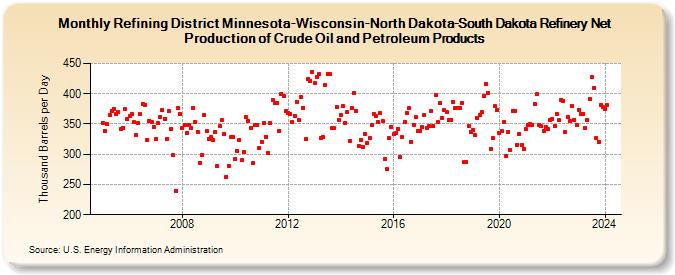
| Refining District Minnesota-Wisconsin-North Dakota-South Dakota Refinery Net Production of Crude Oil and Petroleum Products (Thousand Barrels per Day) | ||||||||
| Year | Jan | Feb | Mar | Apr | May | Jun | Jul | Aug | Sep | Oct | Nov | Dec |
|---|---|---|---|---|---|---|---|---|---|---|---|---|
| 2005 | 352 | 338 | 350 | 365 | 371 | 375 | 366 | 370 | 341 | 343 | 374 | 359 |
| 2006 | 364 | 366 | 353 | 331 | 352 | 366 | 383 | 381 | 324 | 355 | 353 | 345 |
| 2007 | 325 | 351 | 362 | 373 | 359 | 325 | 371 | 342 | 298 | 240 | 377 | 367 |
| 2008 | 344 | 348 | 335 | 349 | 344 | 376 | 353 | 337 | 286 | 299 | 365 | 338 |
| 2009 | 325 | 328 | 323 | 336 | 280 | 346 | 356 | 333 | 263 | 281 | 328 | 329 |
| 2010 | 292 | 306 | 324 | 290 | 304 | 361 | 355 | 343 | 285 | 349 | 348 | 310 |
| 2011 | 321 | 351 | 329 | 302 | 351 | 390 | 385 | 385 | 339 | 400 | 397 | 371 |
| 2012 | 368 | 367 | 353 | 364 | 387 | 356 | 394 | 377 | 325 | 425 | 421 | 436 |
| 2013 | 417 | 427 | 433 | 327 | 328 | 414 | 433 | 432 | 343 | 343 | 378 | 357 |
| 2014 | 365 | 379 | 352 | 369 | 322 | 377 | 401 | 372 | 314 | 324 | 312 | 334 |
| 2015 | 319 | 327 | 348 | 367 | 364 | 353 | 368 | 355 | 292 | 275 | 326 | 345 |
| 2016 | 333 | 335 | 342 | 295 | 328 | 353 | 368 | 376 | 321 | 349 | 361 | 338 |
| 2017 | 338 | 345 | 365 | 344 | 346 | 372 | 346 | 398 | 353 | 384 | 360 | 373 |
| 2018 | 369 | 357 | 357 | 387 | 377 | 377 | 377 | 385 | 287 | 287 | 347 | 337 |
| 2019 | 340 | 331 | 360 | 365 | 370 | 397 | 416 | 402 | 309 | 326 | 380 | 373 |
| 2020 | 335 | 338 | 354 | 297 | 336 | 307 | 372 | 372 | 316 | 333 | 315 | 309 |
| 2021 | 341 | 348 | 350 | 348 | 383 | 399 | 349 | 346 | 338 | 345 | 342 | 357 |
| 2022 | 358 | 347 | 367 | 356 | 390 | 388 | 337 | 361 | 355 | 379 | 357 | 349 |
| 2023 | 373 | 367 | 367 | 344 | 356 | 392 | 428 | 410 | 326 | 321 | 382 | 378 |
| 2024 | 375 | |||||||||||
| - = No Data Reported; -- = Not Applicable; NA = Not Available; W = Withheld to avoid disclosure of individual company data. |
| Release Date: 3/29/2024 |
| Next Release Date: 4/30/2024 |