|
Download Data (XLS File) |
|
||||||||
|
||||||||
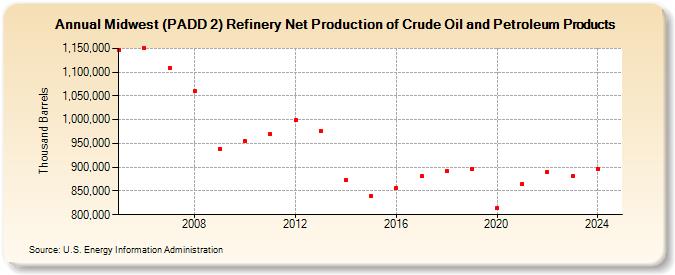
| Midwest (PADD 2) Refinery Net Production of Crude Oil and Petroleum Products (Thousand Barrels) | ||||||||
| Decade | Year-0 | Year-1 | Year-2 | Year-3 | Year-4 | Year-5 | Year-6 | Year-7 | Year-8 | Year-9 |
|---|---|---|---|---|---|---|---|---|---|---|
| 2000's | 1,146,193 | 1,149,780 | 1,109,542 | 1,059,924 | 939,179 | |||||
| 2010's | 955,590 | 969,773 | 999,603 | 976,163 | 873,117 | 839,464 | 855,627 | 880,813 | 891,016 | 896,291 |
| 2020's | 814,322 | 865,420 | 890,540 | 880,536 |
| - = No Data Reported; -- = Not Applicable; NA = Not Available; W = Withheld to avoid disclosure of individual company data. |
| Release Date: 3/29/2024 |
| Next Release Date: 8/30/2024 |