|
Download Data (XLS File) |
|
||||||||
|
||||||||
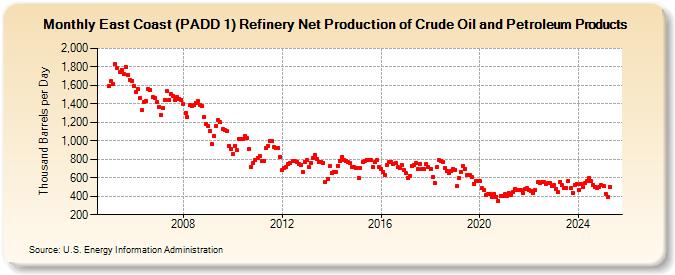
| East Coast (PADD 1) Refinery Net Production of Crude Oil and Petroleum Products (Thousand Barrels per Day) | ||||||||
| Year | Jan | Feb | Mar | Apr | May | Jun | Jul | Aug | Sep | Oct | Nov | Dec |
|---|---|---|---|---|---|---|---|---|---|---|---|---|
| 2005 | 1,594 | 1,644 | 1,614 | 1,831 | 1,792 | 1,740 | 1,771 | 1,723 | 1,799 | 1,713 | 1,660 | 1,647 |
| 2006 | 1,588 | 1,527 | 1,557 | 1,458 | 1,333 | 1,422 | 1,434 | 1,562 | 1,551 | 1,474 | 1,466 | 1,415 |
| 2007 | 1,361 | 1,279 | 1,354 | 1,442 | 1,540 | 1,442 | 1,510 | 1,488 | 1,438 | 1,474 | 1,457 | 1,446 |
| 2008 | 1,399 | 1,304 | 1,259 | 1,383 | 1,375 | 1,383 | 1,413 | 1,428 | 1,382 | 1,376 | 1,256 | 1,183 |
| 2009 | 1,161 | 1,106 | 967 | 1,050 | 1,159 | 1,224 | 1,199 | 1,125 | 1,112 | 1,102 | 945 | 910 |
| 2010 | 857 | 949 | 896 | 1,018 | 1,021 | 1,022 | 1,056 | 1,026 | 911 | 721 | 764 | 796 |
| 2011 | 818 | 831 | 776 | 780 | 920 | 946 | 1,002 | 993 | 931 | 918 | 924 | 829 |
| 2012 | 679 | 710 | 720 | 744 | 757 | 778 | 782 | 766 | 745 | 740 | 662 | 770 |
| 2013 | 788 | 713 | 760 | 819 | 847 | 807 | 773 | 773 | 760 | 549 | 587 | 724 |
| 2014 | 649 | 666 | 664 | 731 | 784 | 825 | 791 | 786 | 769 | 755 | 717 | 715 |
| 2015 | 704 | 592 | 703 | 769 | 785 | 796 | 790 | 792 | 716 | 766 | 787 | 716 |
| 2016 | 698 | 665 | 632 | 741 | 774 | 772 | 744 | 758 | 713 | 707 | 739 | 688 |
| 2017 | 648 | 598 | 623 | 728 | 743 | 759 | 694 | 753 | 693 | 692 | 753 | 711 |
| 2018 | 693 | 612 | 547 | 711 | 789 | 786 | 774 | 710 | 670 | 647 | 676 | 697 |
| 2019 | 687 | 508 | 596 | 667 | 729 | 698 | 628 | 626 | 606 | 537 | 567 | 567 |
| 2020 | 562 | 486 | 463 | 411 | 428 | 429 | 393 | 428 | 392 | 347 | 402 | 403 |
| 2021 | 423 | 403 | 439 | 413 | 444 | 483 | 464 | 468 | 464 | 437 | 475 | 486 |
| 2022 | 466 | 458 | 435 | 467 | 551 | 548 | 552 | 552 | 527 | 542 | 546 | 510 |
| 2023 | 517 | 479 | 441 | 554 | 519 | 484 | 491 | 562 | 489 | 436 | 522 | 536 |
| 2024 | 471 | |||||||||||
| - = No Data Reported; -- = Not Applicable; NA = Not Available; W = Withheld to avoid disclosure of individual company data. |
| Release Date: 3/29/2024 |
| Next Release Date: 4/30/2024 |