|
Download Data (XLS File) |
|
||||||||
|
||||||||
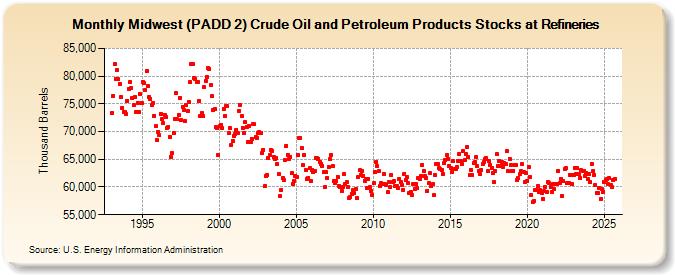
| Midwest (PADD 2) Crude Oil and Petroleum Products Stocks at Refineries (Thousand Barrels) | ||||||||
| Year | Jan | Feb | Mar | Apr | May | Jun | Jul | Aug | Sep | Oct | Nov | Dec |
|---|---|---|---|---|---|---|---|---|---|---|---|---|
| 1993 | 73,436 | 76,459 | 82,169 | 79,479 | 81,160 | 79,417 | 78,663 | 76,261 | 74,326 | 73,505 | 73,569 | 73,180 |
| 1994 | 75,567 | 77,693 | 78,978 | 77,872 | 76,029 | 74,731 | 76,235 | 73,589 | 75,235 | 73,456 | 76,759 | 75,081 |
| 1995 | 78,988 | 78,677 | 77,488 | 80,899 | 78,149 | 76,260 | 75,944 | 74,821 | 75,123 | 72,855 | 70,950 | 68,537 |
| 1996 | 70,007 | 69,294 | 73,236 | 72,247 | 71,494 | 73,005 | 72,683 | 70,561 | 70,866 | 69,079 | 65,416 | 66,152 |
| 1997 | 69,702 | 72,321 | 77,003 | 72,174 | 73,061 | 76,075 | 71,995 | 74,487 | 73,945 | 71,861 | 74,727 | 73,622 |
| 1998 | 75,366 | 78,959 | 82,109 | 82,096 | 79,698 | 79,477 | 79,012 | 78,949 | 75,597 | 72,785 | 73,337 | 72,730 |
| 1999 | 77,952 | 79,125 | 79,811 | 81,466 | 81,343 | 78,414 | 76,352 | 73,875 | 74,026 | 70,750 | 70,569 | 65,748 |
| 2000 | 70,954 | 71,249 | 70,580 | 74,113 | 72,797 | 74,573 | 74,527 | 69,664 | 70,560 | 67,614 | 68,373 | 69,200 |
| 2001 | 69,563 | 70,362 | 69,656 | 73,741 | 74,810 | 72,817 | 70,705 | 69,679 | 71,656 | 70,887 | 68,080 | 71,047 |
| 2002 | 68,109 | 68,710 | 71,334 | 71,309 | 69,064 | 68,908 | 69,744 | 69,835 | 69,735 | 66,143 | 66,740 | 60,112 |
| 2003 | 61,955 | 62,182 | 65,319 | 65,808 | 66,721 | 66,548 | 65,385 | 65,069 | 65,161 | 64,189 | 62,356 | 58,321 |
| 2004 | 59,526 | 61,598 | 61,204 | 64,832 | 67,470 | 65,837 | 65,035 | 65,441 | 62,471 | 60,536 | 61,119 | 62,036 |
| 2005 | 61,779 | 65,796 | 68,845 | 68,853 | 67,110 | 63,883 | 65,762 | 63,100 | 61,527 | 61,699 | 63,343 | 61,029 |
| 2006 | 63,144 | 62,618 | 62,907 | 65,183 | 65,196 | 65,112 | 64,572 | 64,204 | 63,860 | 62,694 | 60,001 | 62,664 |
| 2007 | 61,686 | 63,657 | 65,011 | 65,730 | 63,840 | 60,997 | 60,729 | 61,060 | 61,851 | 60,212 | 60,040 | 59,234 |
| 2008 | 60,070 | 62,276 | 60,482 | 60,847 | 59,929 | 58,046 | 58,158 | 58,781 | 59,414 | 58,866 | 59,644 | 57,949 |
| 2009 | 61,810 | 62,988 | 62,193 | 62,904 | 62,004 | 61,083 | 61,525 | 59,730 | 61,478 | 59,965 | 59,245 | 58,501 |
| 2010 | 60,644 | 62,626 | 64,551 | 63,711 | 62,884 | 60,233 | 60,633 | 60,604 | 62,346 | 60,482 | 60,359 | 59,019 |
| 2011 | 60,878 | 59,921 | 62,168 | 60,871 | 61,121 | 60,118 | 60,175 | 59,810 | 61,365 | 60,915 | 60,365 | 59,528 |
| 2012 | 62,426 | 61,284 | 61,839 | 60,681 | 58,956 | 59,105 | 58,552 | 60,567 | 59,667 | 60,604 | 59,785 | 61,587 |
| 2013 | 61,365 | 62,002 | 63,931 | 62,975 | 61,965 | 61,632 | 59,323 | 60,700 | 62,435 | 60,092 | 60,455 | 58,476 |
| 2014 | 62,117 | 64,073 | 64,147 | 63,357 | 63,243 | 63,106 | 62,418 | 64,311 | 64,953 | 65,725 | 65,128 | 63,869 |
| 2015 | 63,356 | 62,669 | 64,652 | 63,203 | 63,307 | 63,523 | 64,674 | 66,014 | 64,615 | 64,119 | 66,476 | 64,834 |
| 2016 | 65,950 | 67,174 | 65,320 | 62,163 | 63,067 | 62,159 | 64,267 | 64,555 | 65,398 | 63,717 | 62,952 | 62,306 |
| 2017 | 63,027 | 64,213 | 64,507 | 64,987 | 65,182 | 62,813 | 64,686 | 63,976 | 63,504 | 62,541 | 60,870 | 62,909 |
| 2018 | 65,950 | 63,784 | 64,742 | 63,833 | 64,473 | 63,565 | 64,367 | 64,082 | 66,410 | 62,883 | 65,061 | 63,952 |
| 2019 | 62,844 | 62,902 | 64,037 | 63,950 | 61,328 | 61,636 | 62,270 | 62,858 | 64,129 | 62,793 | 60,918 | 62,521 |
| 2020 | 61,119 | 63,579 | 61,794 | 58,559 | 57,257 | 57,542 | 59,416 | 59,477 | 60,136 | 59,094 | 59,444 | 58,839 |
| 2021 | 57,874 | 59,193 | 59,982 | 59,020 | 60,966 | 60,691 | 59,995 | 59,107 | 60,545 | 59,655 | 60,603 | 60,516 |
| 2022 | 62,918 | 60,647 | 61,461 | 58,434 | 61,036 | 63,186 | 63,370 | 60,633 | 60,751 | 62,207 | 62,241 | 60,563 |
| 2023 | 62,033 | 63,325 | 62,240 | 63,206 | 62,245 | 61,489 | 62,844 | 62,808 | 62,710 | 61,774 | 62,359 | 61,548 |
| 2024 | 62,354 | 60,843 | 64,203 | 62,807 | ||||||||
| - = No Data Reported; -- = Not Applicable; NA = Not Available; W = Withheld to avoid disclosure of individual company data. |
| Release Date: 6/28/2024 |
| Next Release Date: 7/31/2024 |