|
Download Data (XLS File) |
|
||||||||
|
||||||||
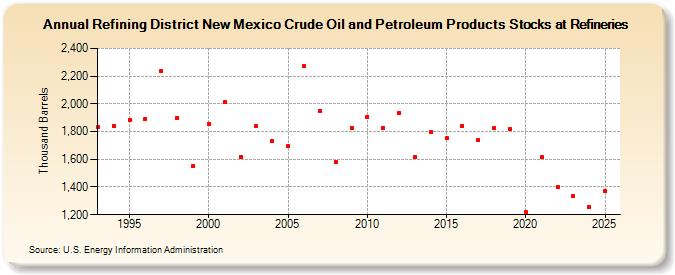
| Refining District New Mexico Crude Oil and Petroleum Products Stocks at Refineries (Thousand Barrels) | ||||||||
| Decade | Year-0 | Year-1 | Year-2 | Year-3 | Year-4 | Year-5 | Year-6 | Year-7 | Year-8 | Year-9 |
|---|---|---|---|---|---|---|---|---|---|---|
| 1990's | 1,835 | 1,840 | 1,886 | 1,891 | 2,238 | 1,901 | 1,549 | |||
| 2000's | 1,852 | 2,010 | 1,616 | 1,838 | 1,733 | 1,695 | 2,276 | 1,951 | 1,583 | 1,828 |
| 2010's | 1,907 | 1,828 | 1,936 | 1,614 | 1,795 | 1,750 | 1,842 | 1,737 | 1,824 | 1,819 |
| 2020's | 1,216 | 1,615 | 1,399 | 1,332 |
| - = No Data Reported; -- = Not Applicable; NA = Not Available; W = Withheld to avoid disclosure of individual company data. |
| Release Date: 6/28/2024 |
| Next Release Date: 8/30/2024 |