|
Download Data (XLS File) |
|
||||||||
|
||||||||
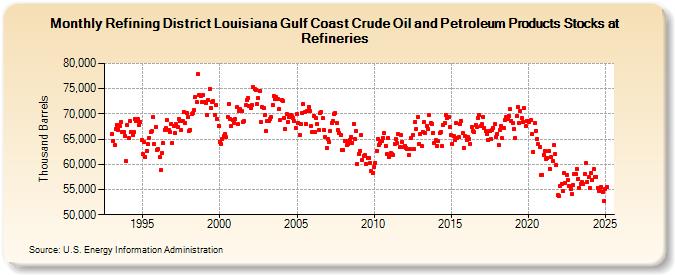
| Refining District Louisiana Gulf Coast Crude Oil and Petroleum Products Stocks at Refineries (Thousand Barrels) | ||||||||
| Year | Jan | Feb | Mar | Apr | May | Jun | Jul | Aug | Sep | Oct | Nov | Dec |
|---|---|---|---|---|---|---|---|---|---|---|---|---|
| 1993 | 66,025 | 64,674 | 63,782 | 67,005 | 67,850 | 66,875 | 67,584 | 68,439 | 66,472 | 66,504 | 65,653 | 60,627 |
| 1994 | 67,783 | 65,143 | 68,512 | 66,346 | 65,908 | 66,466 | 69,048 | 68,635 | 68,988 | 67,741 | 68,448 | 64,868 |
| 1995 | 62,009 | 64,393 | 61,404 | 62,723 | 63,984 | 65,276 | 66,378 | 66,551 | 69,328 | 64,035 | 67,363 | 62,893 |
| 1996 | 62,944 | 61,498 | 58,848 | 62,217 | 64,164 | 66,878 | 67,120 | 68,781 | 66,858 | 66,322 | 68,045 | 64,258 |
| 1997 | 67,644 | 66,197 | 67,991 | 67,445 | 68,906 | 68,539 | 66,788 | 68,500 | 70,378 | 68,218 | 70,186 | 69,414 |
| 1998 | 66,558 | 66,854 | 69,885 | 70,235 | 70,730 | 73,346 | 72,397 | 77,823 | 73,832 | 73,514 | 72,275 | 73,819 |
| 1999 | 72,394 | 72,085 | 69,800 | 72,732 | 74,974 | 71,222 | 72,306 | 72,477 | 69,799 | 71,665 | 68,986 | 67,689 |
| 2000 | 64,416 | 64,079 | 65,039 | 65,651 | 65,968 | 65,334 | 69,476 | 72,056 | 69,062 | 67,647 | 68,826 | 68,266 |
| 2001 | 68,994 | 71,289 | 68,033 | 70,651 | 70,914 | 70,515 | 68,488 | 68,557 | 71,712 | 72,690 | 73,176 | 71,514 |
| 2002 | 71,164 | 71,761 | 75,366 | 74,920 | 74,792 | 71,864 | 73,145 | 74,566 | 68,325 | 71,277 | 71,071 | 69,700 |
| 2003 | 66,582 | 68,512 | 68,654 | 69,012 | 69,352 | 71,778 | 73,593 | 72,877 | 73,285 | 72,895 | 70,889 | 68,879 |
| 2004 | 72,658 | 72,634 | 69,253 | 67,006 | 69,968 | 68,425 | 69,420 | 69,821 | 69,628 | 69,251 | 68,507 | 67,177 |
| 2005 | 70,008 | 68,253 | 65,820 | 67,990 | 70,078 | 71,999 | 70,310 | 68,026 | 70,669 | 71,309 | 70,512 | 67,541 |
| 2006 | 66,327 | 69,599 | 66,405 | 69,157 | 68,026 | 66,822 | 70,228 | 70,364 | 69,103 | 66,758 | 65,377 | 63,284 |
| 2007 | 65,009 | 64,374 | 66,630 | 68,155 | 68,671 | 69,912 | 70,219 | 68,213 | 66,811 | 66,299 | 65,826 | 62,792 |
| 2008 | 62,745 | 64,643 | 64,585 | 63,832 | 64,102 | 64,919 | 65,450 | 64,313 | 67,995 | 65,065 | 66,629 | 60,068 |
| 2009 | 61,994 | 62,644 | 65,813 | 60,933 | 61,686 | 61,766 | 60,011 | 61,305 | 61,253 | 60,283 | 58,576 | 58,326 |
| 2010 | 59,478 | 60,270 | 62,696 | 64,992 | 63,794 | 64,198 | 64,650 | 65,310 | 66,291 | 63,703 | 61,963 | 65,182 |
| 2011 | 61,459 | 62,326 | 62,104 | 61,834 | 64,117 | 64,938 | 64,164 | 65,995 | 63,382 | 65,820 | 64,380 | 63,530 |
| 2012 | 63,638 | 63,178 | 63,001 | 61,820 | 63,046 | 65,206 | 65,850 | 62,987 | 68,414 | 67,020 | 69,385 | 64,067 |
| 2013 | 66,011 | 63,693 | 66,483 | 68,394 | 66,191 | 67,519 | 67,001 | 69,799 | 68,194 | 67,999 | 66,259 | 64,187 |
| 2014 | 64,739 | 63,657 | 64,528 | 66,294 | 66,397 | 63,577 | 67,865 | 68,119 | 69,863 | 69,139 | 69,286 | 67,354 |
| 2015 | 65,759 | 64,072 | 65,569 | 64,811 | 68,225 | 65,299 | 65,391 | 68,093 | 68,595 | 66,205 | 63,241 | 65,637 |
| 2016 | 64,919 | 65,328 | 65,103 | 64,091 | 67,311 | 66,527 | 66,337 | 67,815 | 67,376 | 69,230 | 69,684 | 67,610 |
| 2017 | 67,942 | 69,471 | 67,223 | 66,685 | 65,951 | 64,792 | 66,684 | 64,952 | 66,788 | 67,289 | 67,966 | 65,342 |
| 2018 | 66,063 | 63,900 | 66,855 | 67,604 | 65,164 | 67,166 | 68,791 | 69,393 | 69,085 | 69,681 | 70,898 | 68,603 |
| 2019 | 68,216 | 67,063 | 65,244 | 69,533 | 71,404 | 68,161 | 70,615 | 69,157 | 68,467 | 71,115 | 67,566 | 68,604 |
| 2020 | 68,667 | 68,328 | 68,781 | 65,978 | 62,492 | 68,238 | 66,657 | 65,074 | 63,938 | 63,388 | 57,885 | 57,934 |
| 2021 | 61,918 | 62,645 | 61,002 | 61,174 | 62,564 | 59,090 | 61,369 | 60,647 | 63,741 | 62,066 | 59,797 | 53,826 |
| 2022 | 53,635 | 55,773 | 56,148 | 54,607 | 58,178 | 56,251 | 57,835 | 56,876 | 55,726 | 55,064 | 54,017 | 55,867 |
| 2023 | 58,050 | 58,292 | 59,072 | 57,145 | 55,170 | 56,059 | 56,090 | 56,064 | 58,110 | 60,165 | 56,555 | 57,479 |
| 2024 | 55,385 | 58,234 | 56,847 | 58,975 | ||||||||
| - = No Data Reported; -- = Not Applicable; NA = Not Available; W = Withheld to avoid disclosure of individual company data. |
| Release Date: 6/28/2024 |
| Next Release Date: 7/31/2024 |