|
Download Data (XLS File) |
|
||||||||
|
||||||||
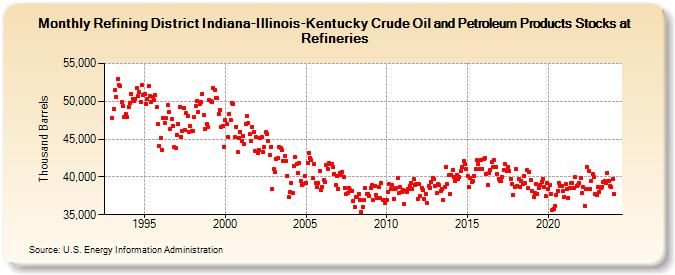
| Refining District Indiana-Illinois-Kentucky Crude Oil and Petroleum Products Stocks at Refineries (Thousand Barrels) | ||||||||
| Year | Jan | Feb | Mar | Apr | May | Jun | Jul | Aug | Sep | Oct | Nov | Dec |
|---|---|---|---|---|---|---|---|---|---|---|---|---|
| 1993 | 47,800 | 48,983 | 51,536 | 50,619 | 52,964 | 52,129 | 51,960 | 49,846 | 49,369 | 47,901 | 48,384 | 47,893 |
| 1994 | 49,309 | 49,764 | 51,006 | 50,308 | 50,071 | 50,321 | 51,745 | 50,637 | 51,243 | 49,935 | 52,130 | 50,874 |
| 1995 | 50,971 | 49,637 | 50,352 | 52,027 | 50,756 | 49,942 | 50,532 | 50,146 | 50,780 | 49,227 | 46,984 | 44,081 |
| 1996 | 45,196 | 43,605 | 47,847 | 47,189 | 47,746 | 49,517 | 48,518 | 46,293 | 47,682 | 46,741 | 43,951 | 43,827 |
| 1997 | 45,596 | 47,049 | 49,239 | 45,331 | 46,072 | 49,171 | 46,187 | 48,434 | 48,032 | 45,988 | 46,732 | 46,036 |
| 1998 | 46,136 | 47,885 | 49,352 | 50,056 | 48,518 | 49,603 | 49,884 | 51,022 | 48,132 | 46,367 | 46,944 | 46,549 |
| 1999 | 50,116 | 50,003 | 49,851 | 51,785 | 51,473 | 50,459 | 50,373 | 48,345 | 48,865 | 46,553 | 46,720 | 44,005 |
| 2000 | 47,462 | 46,937 | 45,337 | 48,344 | 47,503 | 49,713 | 49,682 | 45,217 | 46,645 | 43,269 | 45,158 | 45,987 |
| 2001 | 44,782 | 45,401 | 44,413 | 46,979 | 48,036 | 47,128 | 45,636 | 44,699 | 46,645 | 45,906 | 43,366 | 45,305 |
| 2002 | 43,211 | 43,531 | 45,169 | 45,310 | 43,290 | 43,975 | 45,891 | 45,614 | 44,713 | 42,860 | 43,989 | 38,397 |
| 2003 | 41,001 | 40,628 | 42,333 | 42,461 | 43,981 | 43,810 | 43,548 | 42,075 | 42,788 | 42,107 | 40,157 | 37,312 |
| 2004 | 38,009 | 39,218 | 37,873 | 41,445 | 42,587 | 41,745 | 40,562 | 41,864 | 39,470 | 38,916 | 39,010 | 40,151 |
| 2005 | 39,254 | 41,892 | 43,163 | 42,481 | 42,265 | 39,807 | 41,690 | 39,255 | 38,655 | 39,195 | 40,809 | 38,332 |
| 2006 | 38,726 | 39,614 | 39,309 | 41,620 | 41,101 | 41,776 | 41,753 | 41,685 | 41,312 | 40,397 | 38,885 | 40,107 |
| 2007 | 38,445 | 40,456 | 40,196 | 40,664 | 40,001 | 38,523 | 37,787 | 37,931 | 38,501 | 38,220 | 38,095 | 36,781 |
| 2008 | 35,968 | 37,366 | 37,286 | 37,789 | 36,884 | 35,373 | 36,038 | 36,938 | 38,545 | 37,783 | 37,795 | 37,526 |
| 2009 | 38,483 | 38,903 | 36,975 | 38,805 | 37,634 | 37,193 | 38,655 | 37,212 | 39,159 | 36,937 | 36,886 | 36,591 |
| 2010 | 37,000 | 37,990 | 39,018 | 38,372 | 38,888 | 37,081 | 38,335 | 38,531 | 39,866 | 37,864 | 38,654 | 38,002 |
| 2011 | 38,267 | 36,424 | 38,181 | 38,016 | 38,365 | 38,808 | 39,230 | 38,458 | 39,661 | 38,926 | 39,038 | 37,107 |
| 2012 | 39,019 | 37,442 | 38,572 | 38,253 | 37,099 | 37,765 | 36,557 | 38,764 | 38,572 | 39,313 | 39,831 | 39,674 |
| 2013 | 38,822 | 37,820 | 39,028 | 38,884 | 38,092 | 38,438 | 36,996 | 38,622 | 41,375 | 39,030 | 40,251 | 37,726 |
| 2014 | 40,294 | 40,915 | 39,934 | 39,478 | 40,198 | 39,781 | 39,957 | 40,800 | 41,348 | 42,133 | 41,748 | 41,100 |
| 2015 | 40,098 | 38,627 | 39,874 | 39,308 | 39,479 | 40,124 | 40,984 | 42,173 | 41,711 | 41,089 | 42,175 | 41,079 |
| 2016 | 42,314 | 42,495 | 40,375 | 38,966 | 40,510 | 40,857 | 41,960 | 41,257 | 42,184 | 41,338 | 40,328 | 39,768 |
| 2017 | 39,397 | 39,425 | 39,973 | 40,965 | 41,688 | 40,722 | 41,314 | 40,818 | 39,785 | 39,112 | 37,619 | 38,706 |
| 2018 | 41,065 | 38,732 | 39,718 | 38,720 | 39,435 | 39,066 | 40,113 | 39,181 | 40,936 | 38,555 | 40,656 | 39,576 |
| 2019 | 38,072 | 37,351 | 37,899 | 39,122 | 37,768 | 38,586 | 38,878 | 39,331 | 39,708 | 38,731 | 37,417 | 39,237 |
| 2020 | 38,430 | 38,916 | 37,721 | 35,583 | 35,795 | 36,089 | 37,609 | 38,196 | 39,164 | 38,743 | 38,755 | 38,146 |
| 2021 | 37,295 | 39,027 | 38,457 | 37,275 | 38,476 | 39,206 | 39,210 | 38,570 | 40,034 | 38,838 | 38,967 | 39,169 |
| 2022 | 39,896 | 37,822 | 38,623 | 36,187 | 38,460 | 41,315 | 40,801 | 38,378 | 39,419 | 40,427 | 39,951 | 37,681 |
| 2023 | 37,750 | 38,813 | 38,183 | 38,736 | 38,826 | 39,535 | 39,724 | 39,312 | 40,662 | 39,672 | 39,006 | 38,525 |
| 2024 | 39,669 | 37,793 | 39,848 | 38,422 | 38,561 | 37,980 | ||||||
| - = No Data Reported; -- = Not Applicable; NA = Not Available; W = Withheld to avoid disclosure of individual company data. |
| Release Date: 8/30/2024 |
| Next Release Date: 9/30/2024 |