|
Download Data (XLS File) |
|
||||||||
|
||||||||
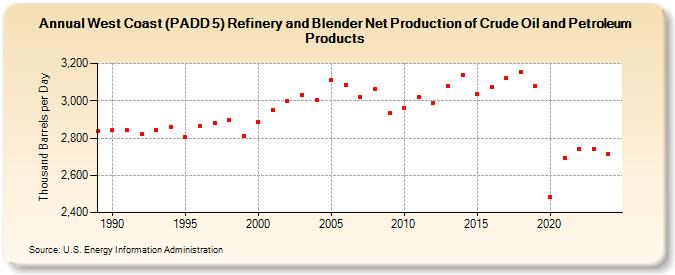
| West Coast (PADD 5) Refinery and Blender Net Production of Crude Oil and Petroleum Products (Thousand Barrels per Day) | ||||||||
| Decade | Year-0 | Year-1 | Year-2 | Year-3 | Year-4 | Year-5 | Year-6 | Year-7 | Year-8 | Year-9 |
|---|---|---|---|---|---|---|---|---|---|---|
| 1980's | 2,835 | |||||||||
| 1990's | 2,845 | 2,842 | 2,821 | 2,845 | 2,857 | 2,805 | 2,865 | 2,879 | 2,897 | 2,813 |
| 2000's | 2,888 | 2,950 | 2,997 | 3,032 | 3,003 | 3,113 | 3,087 | 3,019 | 3,061 | 2,934 |
| 2010's | 2,959 | 3,019 | 2,988 | 3,077 | 3,138 | 3,034 | 3,073 | 3,121 | 3,156 | 3,077 |
| 2020's | 2,481 | 2,695 | 2,742 | 2,742 |
| - = No Data Reported; -- = Not Applicable; NA = Not Available; W = Withheld to avoid disclosure of individual company data. |
| Release Date: 8/30/2024 |
| Next Release Date: 8/29/2025 |