|
Download Data (XLS File) |
|
||||||||
|
||||||||
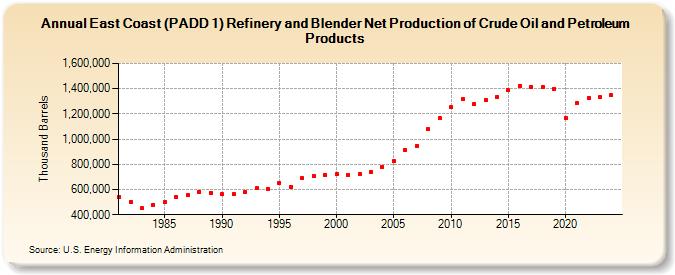
| East Coast (PADD 1) Refinery and Blender Net Production of Crude Oil and Petroleum Products (Thousand Barrels) | ||||||||
| Decade | Year-0 | Year-1 | Year-2 | Year-3 | Year-4 | Year-5 | Year-6 | Year-7 | Year-8 | Year-9 |
|---|---|---|---|---|---|---|---|---|---|---|
| 1980's | 541,817 | 503,469 | 452,899 | 478,359 | 499,616 | 541,118 | 555,184 | 583,404 | 575,297 | |
| 1990's | 564,128 | 565,280 | 581,056 | 609,847 | 602,214 | 652,070 | 622,202 | 688,132 | 709,314 | 715,460 |
| 2000's | 721,675 | 718,363 | 722,014 | 742,335 | 782,018 | 824,861 | 913,309 | 946,021 | 1,080,871 | 1,165,583 |
| 2010's | 1,253,829 | 1,317,656 | 1,280,301 | 1,309,865 | 1,335,591 | 1,386,801 | 1,425,097 | 1,412,981 | 1,412,225 | 1,400,883 |
| 2020's | 1,167,054 | 1,284,909 | 1,324,181 | 1,331,407 |
| - = No Data Reported; -- = Not Applicable; NA = Not Available; W = Withheld to avoid disclosure of individual company data. |
| Release Date: 3/29/2024 |
| Next Release Date: 8/30/2024 |