|
Download Data (XLS File) |
|
||||||||
|
||||||||
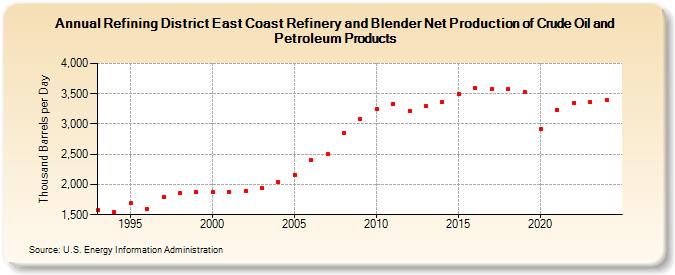
| Refining District East Coast Refinery and Blender Net Production of Crude Oil and Petroleum Products (Thousand Barrels per Day) | ||||||||
| Decade | Year-0 | Year-1 | Year-2 | Year-3 | Year-4 | Year-5 | Year-6 | Year-7 | Year-8 | Year-9 |
|---|---|---|---|---|---|---|---|---|---|---|
| 1990's | 1,573 | 1,553 | 1,689 | 1,600 | 1,793 | 1,853 | 1,868 | |||
| 2000's | 1,883 | 1,881 | 1,891 | 1,941 | 2,043 | 2,163 | 2,405 | 2,501 | 2,856 | 3,080 |
| 2010's | 3,250 | 3,336 | 3,211 | 3,294 | 3,364 | 3,493 | 3,587 | 3,572 | 3,572 | 3,533 |
| 2020's | 2,923 | 3,238 | 3,354 | 3,361 | 3,395 |
| - = No Data Reported; -- = Not Applicable; NA = Not Available; W = Withheld to avoid disclosure of individual company data. |
| Release Date: 6/30/2025 |
| Next Release Date: 8/29/2025 |