|
Download Data (XLS File) |
|
||||||||
|
||||||||
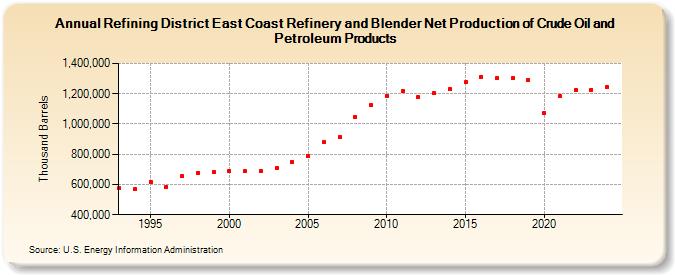
| Refining District East Coast Refinery and Blender Net Production of Crude Oil and Petroleum Products (Thousand Barrels) | ||||||||
| Decade | Year-0 | Year-1 | Year-2 | Year-3 | Year-4 | Year-5 | Year-6 | Year-7 | Year-8 | Year-9 |
|---|---|---|---|---|---|---|---|---|---|---|
| 1990's | 573,996 | 566,833 | 616,531 | 585,704 | 654,567 | 676,340 | 681,925 | |||
| 2000's | 689,213 | 686,589 | 690,200 | 708,462 | 747,869 | 789,318 | 877,981 | 912,842 | 1,045,440 | 1,124,205 |
| 2010's | 1,186,085 | 1,217,595 | 1,175,312 | 1,202,487 | 1,228,025 | 1,274,788 | 1,312,734 | 1,303,691 | 1,303,698 | 1,289,463 |
| 2020's | 1,069,672 | 1,182,006 | 1,224,220 | 1,226,654 |
| - = No Data Reported; -- = Not Applicable; NA = Not Available; W = Withheld to avoid disclosure of individual company data. |
| Release Date: 3/29/2024 |
| Next Release Date: 8/30/2024 |