|
Download Data (XLS File) |
|
||||||||
|
||||||||
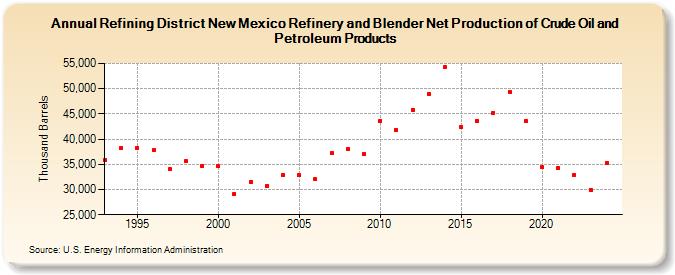
| Refining District New Mexico Refinery and Blender Net Production of Crude Oil and Petroleum Products (Thousand Barrels) | ||||||||
| Decade | Year-0 | Year-1 | Year-2 | Year-3 | Year-4 | Year-5 | Year-6 | Year-7 | Year-8 | Year-9 |
|---|---|---|---|---|---|---|---|---|---|---|
| 1990's | 35,814 | 38,136 | 38,321 | 37,855 | 33,984 | 35,600 | 34,672 | |||
| 2000's | 34,591 | 29,174 | 31,517 | 30,696 | 32,863 | 32,842 | 32,010 | 37,210 | 38,065 | 37,035 |
| 2010's | 43,684 | 41,873 | 45,862 | 48,992 | 54,314 | 42,419 | 43,645 | 45,214 | 49,424 | 43,590 |
| 2020's | 34,370 | 34,294 | 32,892 | 30,053 |
| - = No Data Reported; -- = Not Applicable; NA = Not Available; W = Withheld to avoid disclosure of individual company data. |
| Release Date: 3/29/2024 |
| Next Release Date: 8/30/2024 |