|
Download Data (XLS File) |
|
||||||||
|
||||||||
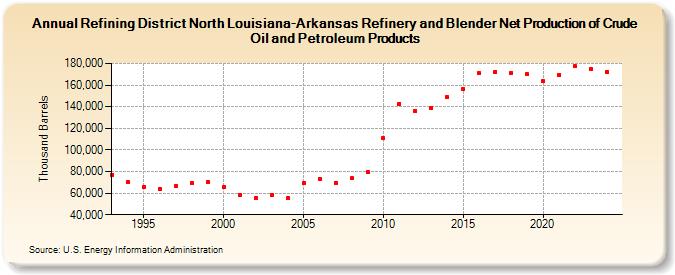
| Refining District North Louisiana-Arkansas Refinery and Blender Net Production of Crude Oil and Petroleum Products (Thousand Barrels) | ||||||||
| Decade | Year-0 | Year-1 | Year-2 | Year-3 | Year-4 | Year-5 | Year-6 | Year-7 | Year-8 | Year-9 |
|---|---|---|---|---|---|---|---|---|---|---|
| 1990's | 77,004 | 69,847 | 65,929 | 63,575 | 66,684 | 69,091 | 70,164 | |||
| 2000's | 65,517 | 57,873 | 55,513 | 57,906 | 55,311 | 69,335 | 73,136 | 69,664 | 73,634 | 79,299 |
| 2010's | 110,805 | 142,847 | 136,207 | 138,899 | 148,833 | 156,266 | 170,874 | 172,507 | 171,450 | 170,021 |
| 2020's | 163,434 | 169,678 | 177,277 | 174,687 |
| - = No Data Reported; -- = Not Applicable; NA = Not Available; W = Withheld to avoid disclosure of individual company data. |
| Release Date: 3/29/2024 |
| Next Release Date: 8/30/2024 |