|
Download Data (XLS File) |
|
||||||||
|
||||||||
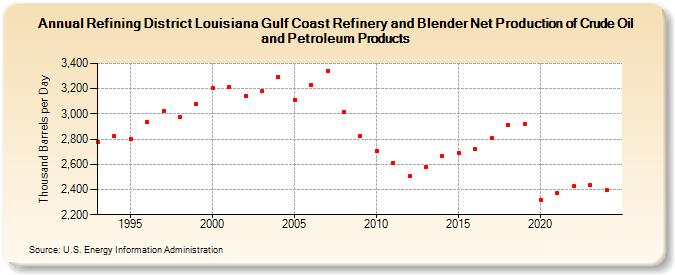
| Refining District Louisiana Gulf Coast Refinery and Blender Net Production of Crude Oil and Petroleum Products (Thousand Barrels per Day) | ||||||||
| Decade | Year-0 | Year-1 | Year-2 | Year-3 | Year-4 | Year-5 | Year-6 | Year-7 | Year-8 | Year-9 |
|---|---|---|---|---|---|---|---|---|---|---|
| 1990's | 2,776 | 2,826 | 2,802 | 2,939 | 3,024 | 2,977 | 3,080 | |||
| 2000's | 3,209 | 3,213 | 3,144 | 3,179 | 3,291 | 3,110 | 3,228 | 3,339 | 3,014 | 2,827 |
| 2010's | 2,709 | 2,614 | 2,504 | 2,575 | 2,663 | 2,690 | 2,722 | 2,807 | 2,915 | 2,917 |
| 2020's | 2,316 | 2,370 | 2,425 | 2,434 |
| - = No Data Reported; -- = Not Applicable; NA = Not Available; W = Withheld to avoid disclosure of individual company data. |
| Release Date: 3/29/2024 |
| Next Release Date: 8/30/2024 |