|
Download Data (XLS File) |
|
||||||||
|
||||||||
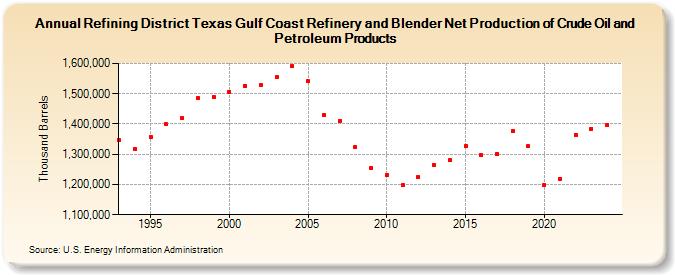
| Refining District Texas Gulf Coast Refinery and Blender Net Production of Crude Oil and Petroleum Products (Thousand Barrels) | ||||||||
| Decade | Year-0 | Year-1 | Year-2 | Year-3 | Year-4 | Year-5 | Year-6 | Year-7 | Year-8 | Year-9 |
|---|---|---|---|---|---|---|---|---|---|---|
| 1990's | 1,346,107 | 1,317,117 | 1,357,558 | 1,398,391 | 1,419,918 | 1,485,784 | 1,488,948 | |||
| 2000's | 1,505,773 | 1,525,148 | 1,528,012 | 1,554,129 | 1,590,829 | 1,540,785 | 1,430,490 | 1,411,395 | 1,324,567 | 1,255,667 |
| 2010's | 1,232,069 | 1,197,299 | 1,224,060 | 1,264,595 | 1,281,627 | 1,327,587 | 1,296,840 | 1,301,588 | 1,375,626 | 1,325,875 |
| 2020's | 1,197,544 | 1,219,084 | 1,364,102 | 1,388,630 |
| - = No Data Reported; -- = Not Applicable; NA = Not Available; W = Withheld to avoid disclosure of individual company data. |
| Release Date: 3/29/2024 |
| Next Release Date: 8/30/2024 |