|
Download Data (XLS File) |
|
||||||||
|
||||||||
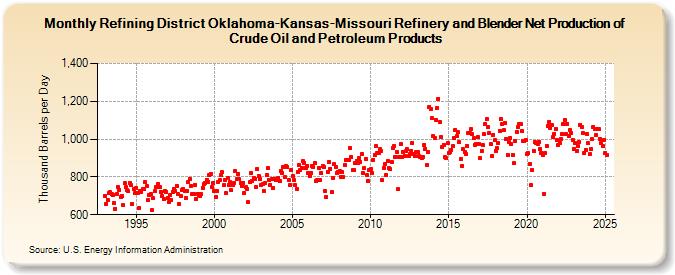
| Refining District Oklahoma-Kansas-Missouri Refinery and Blender Net Production of Crude Oil and Petroleum Products (Thousand Barrels per Day) | ||||||||
| Year | Jan | Feb | Mar | Apr | May | Jun | Jul | Aug | Sep | Oct | Nov | Dec |
|---|---|---|---|---|---|---|---|---|---|---|---|---|
| 1993 | 701 | 658 | 679 | 713 | 718 | 711 | 704 | 663 | 632 | 710 | 746 | 733 |
| 1994 | 694 | 699 | 650 | 766 | 745 | 730 | 723 | 768 | 755 | 657 | 736 | 714 |
| 1995 | 740 | 717 | 637 | 725 | 719 | 735 | 734 | 771 | 750 | 678 | 702 | 709 |
| 1996 | 624 | 688 | 724 | 744 | 747 | 763 | 747 | 722 | 700 | 683 | 726 | 722 |
| 1997 | 689 | 665 | 702 | 676 | 722 | 737 | 725 | 753 | 707 | 659 | 697 | 733 |
| 1998 | 736 | 728 | 690 | 723 | 771 | 791 | 752 | 707 | 712 | 758 | 684 | 712 |
| 1999 | 706 | 697 | 707 | 742 | 761 | 769 | 786 | 775 | 808 | 817 | 746 | 767 |
| 2000 | 723 | 694 | 727 | 775 | 783 | 810 | 825 | 757 | 781 | 713 | 792 | 759 |
| 2001 | 771 | 729 | 758 | 768 | 830 | 787 | 816 | 787 | 767 | 751 | 770 | 714 |
| 2002 | 745 | 735 | 667 | 771 | 819 | 780 | 795 | 791 | 745 | 841 | 804 | 788 |
| 2003 | 759 | 762 | 726 | 770 | 811 | 845 | 784 | 756 | 788 | 741 | 791 | 786 |
| 2004 | 784 | 793 | 776 | 832 | 823 | 851 | 798 | 859 | 852 | 784 | 759 | 835 |
| 2005 | 807 | 781 | 755 | 736 | 826 | 863 | 839 | 849 | 882 | 876 | 849 | 859 |
| 2006 | 823 | 807 | 821 | 859 | 852 | 874 | 780 | 783 | 849 | 783 | 820 | 858 |
| 2007 | 850 | 723 | 694 | 824 | 880 | 844 | 720 | 793 | 867 | 854 | 819 | 828 |
| 2008 | 832 | 802 | 824 | 800 | 862 | 891 | 891 | 891 | 952 | 906 | 834 | 836 |
| 2009 | 872 | 885 | 872 | 901 | 879 | 921 | 822 | 847 | 895 | 809 | 777 | 838 |
| 2010 | 842 | 820 | 892 | 917 | 961 | 928 | 925 | 946 | 938 | 783 | 845 | 867 |
| 2011 | 811 | 884 | 846 | 840 | 880 | 952 | 964 | 907 | 934 | 734 | 904 | 973 |
| 2012 | 903 | 930 | 913 | 936 | 946 | 913 | 919 | 939 | 979 | 919 | 909 | 933 |
| 2013 | 933 | 909 | 907 | 899 | 904 | 971 | 949 | 864 | 934 | 1,171 | 1,160 | 1,109 |
| 2014 | 1,014 | 1,006 | 1,103 | 1,166 | 1,214 | 1,091 | 1,011 | 957 | 971 | 903 | 899 | 977 |
| 2015 | 924 | 933 | 944 | 963 | 1,008 | 1,048 | 1,015 | 1,035 | 983 | 894 | 860 | 945 |
| 2016 | 931 | 920 | 966 | 1,034 | 1,030 | 1,051 | 1,025 | 1,005 | 971 | 974 | 1,011 | 974 |
| 2017 | 898 | 939 | 971 | 1,025 | 1,082 | 1,105 | 1,066 | 1,032 | 972 | 911 | 1,024 | 993 |
| 2018 | 938 | 951 | 979 | 1,043 | 1,105 | 1,082 | 1,047 | 1,084 | 1,000 | 914 | 987 | 1,006 |
| 2019 | 974 | 917 | 871 | 989 | 1,038 | 1,064 | 1,082 | 1,078 | 1,043 | 992 | 992 | 995 |
| 2020 | 922 | 924 | 868 | 755 | 835 | 939 | 983 | 981 | 973 | 987 | 946 | 928 |
| 2021 | 917 | 712 | 927 | 966 | 1,070 | 1,093 | 1,061 | 1,075 | 1,009 | 1,029 | 1,053 | 994 |
| 2022 | 969 | 980 | 1,001 | 1,026 | 1,079 | 1,099 | 1,027 | 1,082 | 1,015 | 1,048 | 1,032 | 994 |
| 2023 | 944 | 980 | 939 | 963 | 985 | 1,077 | 1,063 | 1,030 | 925 | 943 | 1,028 | 978 |
| 2024 | 920 | |||||||||||
| - = No Data Reported; -- = Not Applicable; NA = Not Available; W = Withheld to avoid disclosure of individual company data. |
| Release Date: 3/29/2024 |
| Next Release Date: 4/30/2024 |