|
Download Data (XLS File) |
|
||||||||
|
||||||||
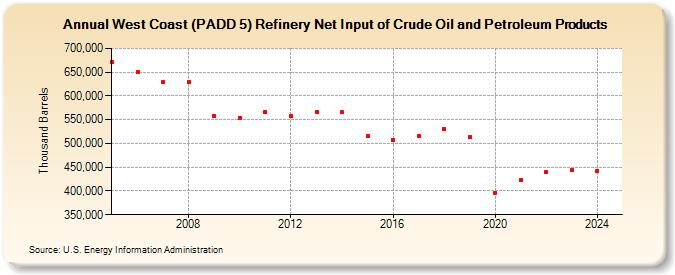
| West Coast (PADD 5) Refinery Net Input of Crude Oil and Petroleum Products (Thousand Barrels) | ||||||||
| Decade | Year-0 | Year-1 | Year-2 | Year-3 | Year-4 | Year-5 | Year-6 | Year-7 | Year-8 | Year-9 |
|---|---|---|---|---|---|---|---|---|---|---|
| 2000's | 670,779 | 651,047 | 628,228 | 628,286 | 558,594 | |||||
| 2010's | 553,736 | 566,455 | 557,984 | 566,209 | 565,481 | 514,703 | 507,999 | 516,564 | 531,264 | 513,993 |
| 2020's | 396,257 | 422,486 | 440,080 | 443,380 |
| - = No Data Reported; -- = Not Applicable; NA = Not Available; W = Withheld to avoid disclosure of individual company data. |
| Release Date: 3/29/2024 |
| Next Release Date: 8/30/2024 |