|
Download Data (XLS File) |
|
||||||||
|
||||||||
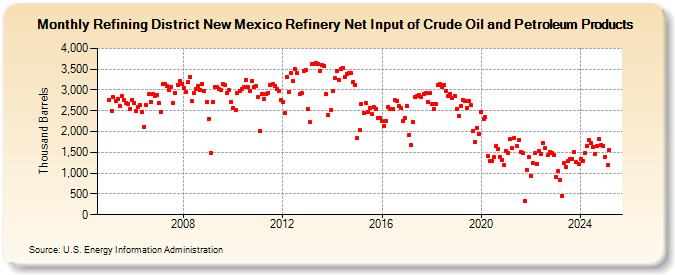
| Refining District New Mexico Refinery Net Input of Crude Oil and Petroleum Products (Thousand Barrels) | ||||||||
| Year | Jan | Feb | Mar | Apr | May | Jun | Jul | Aug | Sep | Oct | Nov | Dec |
|---|---|---|---|---|---|---|---|---|---|---|---|---|
| 2005 | 2,761 | 2,505 | 2,823 | 2,736 | 2,775 | 2,617 | 2,843 | 2,755 | 2,687 | 2,672 | 2,553 | 2,769 |
| 2006 | 2,686 | 2,486 | 2,599 | 2,629 | 2,463 | 2,119 | 2,633 | 2,900 | 2,722 | 2,900 | 2,864 | 2,874 |
| 2007 | 2,687 | 2,479 | 3,143 | 3,153 | 3,105 | 2,995 | 3,076 | 2,692 | 2,925 | 3,121 | 3,210 | 3,138 |
| 2008 | 3,055 | 2,944 | 3,183 | 3,300 | 2,737 | 2,926 | 3,027 | 3,107 | 3,009 | 3,144 | 2,976 | 2,718 |
| 2009 | 2,311 | 1,491 | 2,713 | 3,069 | 3,083 | 3,033 | 3,005 | 3,140 | 3,115 | 2,916 | 2,996 | 2,714 |
| 2010 | 2,557 | 2,527 | 2,938 | 2,972 | 3,016 | 3,063 | 3,241 | 3,080 | 2,981 | 3,205 | 3,060 | 3,096 |
| 2011 | 2,833 | 2,009 | 2,904 | 2,784 | 2,902 | 2,934 | 3,113 | 3,142 | 3,090 | 3,012 | 2,976 | 2,748 |
| 2012 | 2,721 | 2,444 | 3,300 | 2,947 | 3,417 | 3,208 | 3,493 | 3,416 | 2,914 | 2,934 | 3,453 | 3,475 |
| 2013 | 2,531 | 2,222 | 3,626 | 3,622 | 3,658 | 3,622 | 3,467 | 3,594 | 3,567 | 2,907 | 2,387 | 2,528 |
| 2014 | 2,967 | 3,277 | 3,447 | 3,248 | 3,512 | 3,528 | 3,320 | 3,396 | 3,409 | 3,401 | 3,188 | 3,128 |
| 2015 | 1,833 | 2,036 | 2,657 | 2,447 | 2,692 | 2,470 | 2,562 | 2,412 | 2,590 | 2,548 | 2,324 | 2,337 |
| 2016 | 2,246 | 2,133 | 2,258 | 2,599 | 2,545 | 2,539 | 2,761 | 2,729 | 2,612 | 2,557 | 2,255 | 2,324 |
| 2017 | 2,603 | 1,908 | 1,686 | 2,241 | 2,819 | 2,850 | 2,876 | 2,823 | 2,910 | 2,919 | 2,710 | 2,920 |
| 2018 | 2,668 | 2,543 | 2,667 | 3,109 | 3,132 | 3,082 | 3,117 | 2,985 | 2,848 | 2,913 | 2,797 | 2,857 |
| 2019 | 2,553 | 2,379 | 2,610 | 2,770 | 2,746 | 2,556 | 2,728 | 2,628 | 2,020 | 1,744 | 2,093 | 1,953 |
| 2020 | 2,476 | 2,291 | 2,342 | 1,410 | 1,285 | 1,296 | 1,380 | 1,648 | 1,579 | 1,385 | 1,314 | 1,188 |
| 2021 | 1,532 | 1,496 | 1,818 | 1,596 | 1,841 | 1,645 | 1,786 | 1,509 | 1,479 | 335 | 1,085 | 1,381 |
| 2022 | 941 | 1,250 | 1,476 | 1,224 | 1,530 | 1,463 | 1,724 | 1,604 | 1,436 | 1,510 | 1,474 | 1,427 |
| 2023 | 875 | 1,055 | 836 | 460 | 1,250 | 1,155 | 1,300 | 1,343 | 1,350 | 1,507 | 1,260 | 1,208 |
| 2024 | 1,343 | 1,282 | 1,473 | 1,656 | ||||||||
| - = No Data Reported; -- = Not Applicable; NA = Not Available; W = Withheld to avoid disclosure of individual company data. |
| Release Date: 6/28/2024 |
| Next Release Date: 7/31/2024 |