|
Download Data (XLS File) |
|
||||||||
|
||||||||
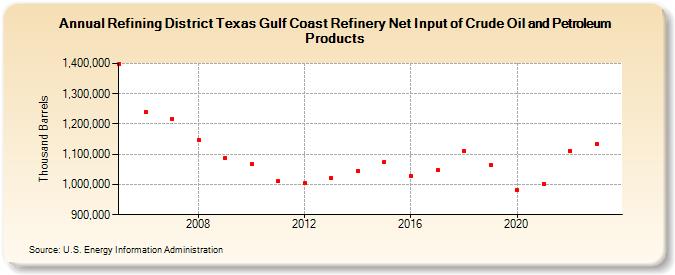
| Refining District Texas Gulf Coast Refinery Net Input of Crude Oil and Petroleum Products (Thousand Barrels) | ||||||||
| Decade | Year-0 | Year-1 | Year-2 | Year-3 | Year-4 | Year-5 | Year-6 | Year-7 | Year-8 | Year-9 |
|---|---|---|---|---|---|---|---|---|---|---|
| 2000's | 1,398,292 | 1,241,181 | 1,217,587 | 1,145,437 | 1,089,104 | |||||
| 2010's | 1,066,428 | 1,009,912 | 1,004,603 | 1,022,539 | 1,046,109 | 1,074,586 | 1,027,822 | 1,047,643 | 1,109,587 | 1,064,689 |
| 2020's | 981,512 | 1,002,716 | 1,112,175 | 1,133,094 |
| - = No Data Reported; -- = Not Applicable; NA = Not Available; W = Withheld to avoid disclosure of individual company data. |
| Release Date: 3/29/2024 |
| Next Release Date: 8/30/2024 |