|
Download Data (XLS File) |
|
||||||||
|
||||||||
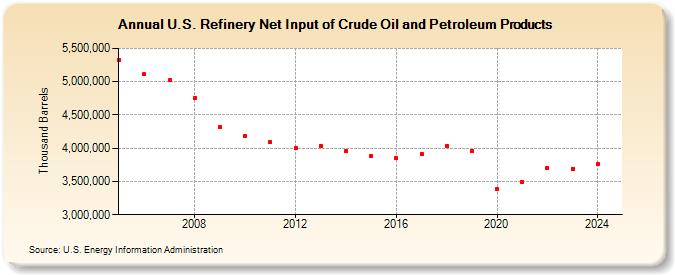
| U.S. Refinery Net Input of Crude Oil and Petroleum Products (Thousand Barrels) | ||||||||
| Decade | Year-0 | Year-1 | Year-2 | Year-3 | Year-4 | Year-5 | Year-6 | Year-7 | Year-8 | Year-9 |
|---|---|---|---|---|---|---|---|---|---|---|
| 2000's | 5,325,339 | 5,110,689 | 5,020,065 | 4,755,700 | 4,319,689 | |||||
| 2010's | 4,178,588 | 4,091,601 | 4,007,375 | 4,037,265 | 3,954,862 | 3,881,471 | 3,845,100 | 3,916,930 | 4,039,771 | 3,961,222 |
| 2020's | 3,381,941 | 3,498,551 | 3,705,697 | 3,691,116 |
| - = No Data Reported; -- = Not Applicable; NA = Not Available; W = Withheld to avoid disclosure of individual company data. |
| Release Date: 8/30/2024 |
| Next Release Date: 8/29/2025 |