|
Download Data (XLS File) |
|
||||||||
|
||||||||
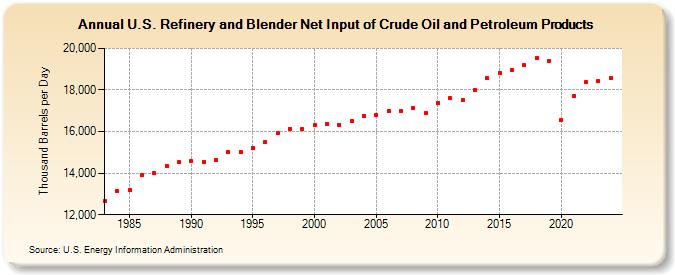
| U.S. Refinery and Blender Net Input of Crude Oil and Petroleum Products (Thousand Barrels per Day) | ||||||||
| Decade | Year-0 | Year-1 | Year-2 | Year-3 | Year-4 | Year-5 | Year-6 | Year-7 | Year-8 | Year-9 |
|---|---|---|---|---|---|---|---|---|---|---|
| 1980's | 12,650 | 13,126 | 13,192 | 13,906 | 13,987 | 14,367 | 14,513 | |||
| 1990's | 14,589 | 14,541 | 14,626 | 15,021 | 15,023 | 15,220 | 15,487 | 15,909 | 16,144 | 16,103 |
| 2000's | 16,295 | 16,382 | 16,316 | 16,513 | 16,762 | 16,811 | 16,981 | 16,999 | 17,153 | 16,904 |
| 2010's | 17,385 | 17,596 | 17,505 | 18,019 | 18,574 | 18,824 | 18,961 | 19,187 | 19,555 | 19,371 |
| 2020's | 16,566 | 17,706 | 18,364 | 18,413 |
| - = No Data Reported; -- = Not Applicable; NA = Not Available; W = Withheld to avoid disclosure of individual company data. |
| Release Date: 3/29/2024 |
| Next Release Date: 8/30/2024 |