|
Download Data (XLS File) |
|
||||||||
|
||||||||
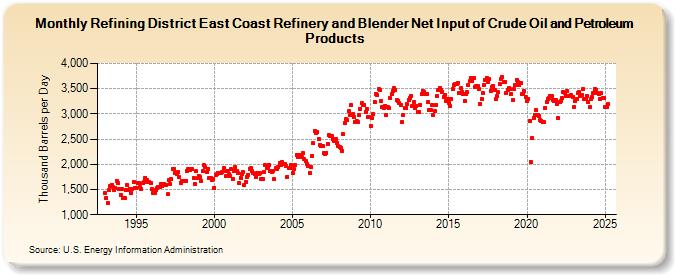
| Refining District East Coast Refinery and Blender Net Input of Crude Oil and Petroleum Products (Thousand Barrels per Day) | ||||||||
| Year | Jan | Feb | Mar | Apr | May | Jun | Jul | Aug | Sep | Oct | Nov | Dec |
|---|---|---|---|---|---|---|---|---|---|---|---|---|
| 1993 | 1,428 | 1,336 | 1,235 | 1,481 | 1,576 | 1,597 | 1,559 | 1,485 | 1,534 | 1,678 | 1,621 | 1,519 |
| 1994 | 1,400 | 1,515 | 1,335 | 1,341 | 1,489 | 1,594 | 1,498 | 1,514 | 1,435 | 1,520 | 1,653 | 1,524 |
| 1995 | 1,528 | 1,629 | 1,637 | 1,547 | 1,513 | 1,623 | 1,655 | 1,735 | 1,679 | 1,643 | 1,651 | 1,627 |
| 1996 | 1,506 | 1,434 | 1,426 | 1,486 | 1,526 | 1,552 | 1,550 | 1,605 | 1,572 | 1,617 | 1,590 | 1,599 |
| 1997 | 1,401 | 1,680 | 1,603 | 1,705 | 1,914 | 1,909 | 1,829 | 1,811 | 1,846 | 1,740 | 1,635 | 1,678 |
| 1998 | 1,664 | 1,673 | 1,677 | 1,871 | 1,904 | 1,882 | 1,909 | 1,899 | 1,737 | 1,619 | 1,861 | 1,722 |
| 1999 | 1,774 | 1,743 | 1,669 | 1,863 | 1,980 | 1,940 | 1,847 | 1,910 | 1,719 | 1,734 | 1,692 | 1,699 |
| 2000 | 1,537 | 1,779 | 1,806 | 1,836 | 1,828 | 1,825 | 1,844 | 1,926 | 1,864 | 1,777 | 1,872 | 1,813 |
| 2001 | 1,762 | 1,898 | 1,716 | 1,876 | 1,950 | 1,869 | 1,834 | 1,634 | 1,737 | 1,808 | 1,838 | 1,590 |
| 2002 | 1,644 | 1,751 | 1,794 | 1,915 | 1,933 | 1,867 | 1,818 | 1,800 | 1,753 | 1,826 | 1,814 | 1,820 |
| 2003 | 1,705 | 1,714 | 1,856 | 1,981 | 1,933 | 1,935 | 1,989 | 1,863 | 1,848 | 1,861 | 1,703 | 1,917 |
| 2004 | 1,908 | 1,955 | 2,016 | 1,983 | 2,039 | 2,001 | 2,014 | 1,962 | 1,755 | 1,918 | 1,935 | 1,982 |
| 2005 | 1,821 | 1,899 | 1,983 | 2,185 | 2,148 | 2,191 | 2,167 | 2,142 | 2,218 | 2,101 | 2,056 | 2,011 |
| 2006 | 1,957 | 1,836 | 1,951 | 2,168 | 2,416 | 2,656 | 2,629 | 2,639 | 2,511 | 2,387 | 2,364 | 2,362 |
| 2007 | 2,229 | 2,198 | 2,226 | 2,411 | 2,578 | 2,554 | 2,560 | 2,505 | 2,457 | 2,501 | 2,413 | 2,358 |
| 2008 | 2,334 | 2,331 | 2,266 | 2,593 | 2,815 | 2,897 | 2,869 | 3,049 | 2,970 | 3,178 | 2,995 | 2,938 |
| 2009 | 2,849 | 2,865 | 2,845 | 2,973 | 3,100 | 3,212 | 3,183 | 3,181 | 3,036 | 3,099 | 2,944 | 2,942 |
| 2010 | 2,754 | 2,916 | 2,988 | 3,238 | 3,396 | 3,370 | 3,486 | 3,475 | 3,247 | 3,134 | 3,117 | 3,162 |
| 2011 | 2,971 | 3,141 | 3,109 | 3,312 | 3,389 | 3,445 | 3,505 | 3,483 | 3,266 | 3,262 | 3,213 | 3,176 |
| 2012 | 2,835 | 2,970 | 3,120 | 3,121 | 3,194 | 3,279 | 3,320 | 3,364 | 3,162 | 3,233 | 3,111 | 3,160 |
| 2013 | 3,042 | 3,043 | 3,184 | 3,388 | 3,459 | 3,438 | 3,395 | 3,399 | 3,233 | 3,068 | 3,069 | 3,186 |
| 2014 | 2,974 | 3,059 | 3,178 | 3,346 | 3,472 | 3,511 | 3,474 | 3,444 | 3,333 | 3,382 | 3,252 | 3,297 |
| 2015 | 3,224 | 3,148 | 3,296 | 3,490 | 3,576 | 3,589 | 3,590 | 3,609 | 3,423 | 3,504 | 3,427 | 3,388 |
| 2016 | 3,254 | 3,398 | 3,427 | 3,573 | 3,648 | 3,716 | 3,647 | 3,703 | 3,527 | 3,551 | 3,544 | 3,486 |
| 2017 | 3,200 | 3,298 | 3,424 | 3,583 | 3,668 | 3,712 | 3,624 | 3,700 | 3,461 | 3,540 | 3,559 | 3,483 |
| 2018 | 3,297 | 3,352 | 3,426 | 3,590 | 3,695 | 3,723 | 3,629 | 3,642 | 3,418 | 3,477 | 3,507 | 3,495 |
| 2019 | 3,397 | 3,275 | 3,492 | 3,569 | 3,677 | 3,633 | 3,575 | 3,610 | 3,393 | 3,404 | 3,446 | 3,340 |
| 2020 | 3,254 | 3,302 | 2,863 | 2,050 | 2,520 | 2,922 | 2,976 | 3,074 | 2,973 | 2,954 | 2,878 | 2,864 |
| 2021 | 2,835 | 2,839 | 3,118 | 3,241 | 3,294 | 3,315 | 3,346 | 3,349 | 3,274 | 3,254 | 3,279 | 3,188 |
| 2022 | 2,919 | 3,231 | 3,264 | 3,317 | 3,437 | 3,421 | 3,364 | 3,448 | 3,358 | 3,350 | 3,369 | 3,327 |
| 2023 | 3,135 | 3,252 | 3,305 | 3,415 | 3,437 | 3,361 | 3,372 | 3,498 | 3,297 | 3,294 | 3,353 | 3,239 |
| 2024 | 3,129 | 3,286 | 3,338 | 3,412 | ||||||||
| - = No Data Reported; -- = Not Applicable; NA = Not Available; W = Withheld to avoid disclosure of individual company data. |
| Release Date: 6/28/2024 |
| Next Release Date: 7/31/2024 |