|
Download Data (XLS File) |
|
||||||||
|
||||||||
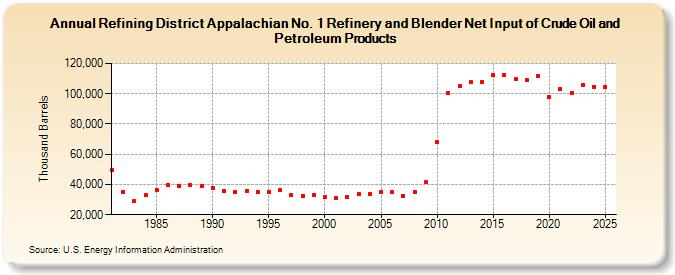
| Refining District Appalachian No. 1 Refinery and Blender Net Input of Crude Oil and Petroleum Products (Thousand Barrels) | ||||||||
| Decade | Year-0 | Year-1 | Year-2 | Year-3 | Year-4 | Year-5 | Year-6 | Year-7 | Year-8 | Year-9 |
|---|---|---|---|---|---|---|---|---|---|---|
| 1980's | 49,554 | 35,332 | 28,993 | 32,739 | 36,199 | 39,615 | 38,866 | 39,459 | 38,841 | |
| 1990's | 37,982 | 35,893 | 35,294 | 35,511 | 34,992 | 35,081 | 36,017 | 33,067 | 32,641 | 33,151 |
| 2000's | 31,989 | 31,211 | 31,419 | 33,385 | 33,666 | 34,983 | 34,745 | 32,623 | 35,058 | 41,306 |
| 2010's | 67,873 | 100,532 | 105,039 | 107,576 | 107,848 | 112,382 | 112,705 | 109,502 | 109,119 | 111,756 |
| 2020's | 97,821 | 103,081 | 100,430 | 105,172 |
| - = No Data Reported; -- = Not Applicable; NA = Not Available; W = Withheld to avoid disclosure of individual company data. |
| Release Date: 3/29/2024 |
| Next Release Date: 8/30/2024 |