|
Download Data (XLS File) |
|
||||||||
|
||||||||
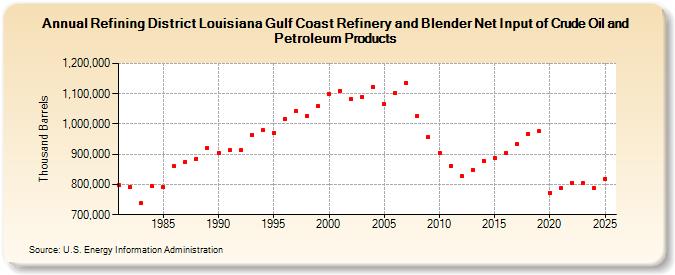
| Refining District Louisiana Gulf Coast Refinery and Blender Net Input of Crude Oil and Petroleum Products (Thousand Barrels) | ||||||||
| Decade | Year-0 | Year-1 | Year-2 | Year-3 | Year-4 | Year-5 | Year-6 | Year-7 | Year-8 | Year-9 |
|---|---|---|---|---|---|---|---|---|---|---|
| 1980's | 797,959 | 791,156 | 738,456 | 793,518 | 790,738 | 860,075 | 874,379 | 885,031 | 921,402 | |
| 1990's | 905,164 | 912,815 | 912,910 | 964,471 | 979,107 | 970,858 | 1,016,547 | 1,041,811 | 1,026,563 | 1,058,727 |
| 2000's | 1,099,616 | 1,110,620 | 1,081,400 | 1,090,672 | 1,122,743 | 1,065,923 | 1,101,066 | 1,136,836 | 1,026,114 | 957,247 |
| 2010's | 904,126 | 861,792 | 828,082 | 849,125 | 878,663 | 888,705 | 903,245 | 932,399 | 967,898 | 975,720 |
| 2020's | 773,236 | 788,368 | 805,749 | 803,442 |
| - = No Data Reported; -- = Not Applicable; NA = Not Available; W = Withheld to avoid disclosure of individual company data. |
| Release Date: 8/30/2024 |
| Next Release Date: 8/29/2025 |