|
Download Data (XLS File) |
|
||||||||
|
||||||||
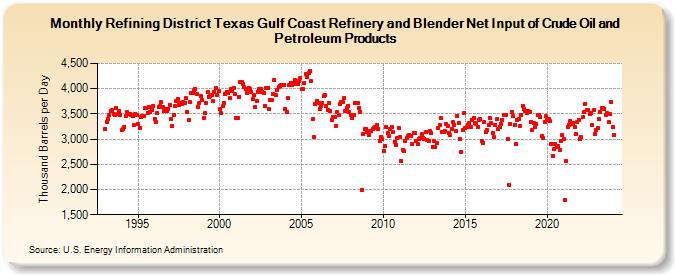
| Refining District Texas Gulf Coast Refinery and Blender Net Input of Crude Oil and Petroleum Products (Thousand Barrels per Day) | ||||||||
| Year | Jan | Feb | Mar | Apr | May | Jun | Jul | Aug | Sep | Oct | Nov | Dec |
|---|---|---|---|---|---|---|---|---|---|---|---|---|
| 1993 | 3,204 | 3,342 | 3,396 | 3,476 | 3,559 | 3,570 | 3,497 | 3,474 | 3,616 | 3,489 | 3,565 | 3,474 |
| 1994 | 3,172 | 3,193 | 3,241 | 3,459 | 3,531 | 3,488 | 3,489 | 3,482 | 3,452 | 3,271 | 3,501 | 3,478 |
| 1995 | 3,296 | 3,228 | 3,434 | 3,466 | 3,464 | 3,624 | 3,626 | 3,521 | 3,628 | 3,534 | 3,574 | 3,660 |
| 1996 | 3,397 | 3,339 | 3,511 | 3,636 | 3,654 | 3,730 | 3,639 | 3,552 | 3,602 | 3,551 | 3,590 | 3,680 |
| 1997 | 3,394 | 3,250 | 3,471 | 3,652 | 3,763 | 3,801 | 3,670 | 3,709 | 3,694 | 3,734 | 3,722 | 3,809 |
| 1998 | 3,541 | 3,386 | 3,729 | 3,909 | 3,915 | 3,967 | 4,001 | 3,898 | 3,641 | 3,725 | 3,847 | 3,780 |
| 1999 | 3,421 | 3,510 | 3,715 | 3,944 | 3,844 | 3,849 | 3,869 | 3,756 | 3,938 | 4,019 | 3,880 | 3,945 |
| 2000 | 3,606 | 3,512 | 3,653 | 3,721 | 3,904 | 3,933 | 3,910 | 3,812 | 3,989 | 3,946 | 4,011 | 3,888 |
| 2001 | 3,411 | 3,420 | 3,843 | 4,127 | 4,130 | 4,100 | 4,028 | 3,990 | 3,913 | 4,014 | 3,997 | 3,929 |
| 2002 | 3,794 | 3,868 | 3,634 | 3,749 | 3,935 | 3,997 | 3,988 | 3,939 | 3,906 | 3,660 | 4,016 | 4,019 |
| 2003 | 3,589 | 3,781 | 3,775 | 3,902 | 4,168 | 3,879 | 3,974 | 4,038 | 4,058 | 4,068 | 4,067 | 4,080 |
| 2004 | 3,596 | 3,530 | 3,813 | 4,070 | 4,118 | 4,083 | 4,118 | 4,176 | 4,100 | 4,091 | 4,153 | 4,212 |
| 2005 | 3,984 | 3,998 | 4,113 | 4,290 | 4,238 | 4,311 | 4,342 | 4,143 | 3,392 | 3,033 | 3,689 | 3,747 |
| 2006 | 3,725 | 3,603 | 3,655 | 3,724 | 3,847 | 3,874 | 3,654 | 3,582 | 3,710 | 3,549 | 3,379 | 3,442 |
| 2007 | 3,435 | 3,263 | 3,543 | 3,485 | 3,688 | 3,745 | 3,727 | 3,821 | 3,552 | 3,621 | 3,666 | 3,537 |
| 2008 | 3,482 | 3,413 | 3,474 | 3,708 | 3,723 | 3,715 | 3,613 | 3,544 | 1,986 | 3,106 | 3,200 | 3,208 |
| 2009 | 3,134 | 3,076 | 3,158 | 3,152 | 3,202 | 3,214 | 3,248 | 3,287 | 3,202 | 2,962 | 3,044 | 3,006 |
| 2010 | 2,761 | 2,863 | 3,238 | 3,113 | 3,053 | 3,197 | 3,237 | 3,133 | 2,946 | 2,883 | 3,023 | 3,218 |
| 2011 | 3,033 | 2,574 | 2,793 | 2,759 | 2,955 | 3,028 | 3,060 | 3,084 | 3,070 | 2,905 | 3,126 | 3,118 |
| 2012 | 2,963 | 2,894 | 2,994 | 3,021 | 3,094 | 3,030 | 3,011 | 3,131 | 2,985 | 2,958 | 3,159 | 3,114 |
| 2013 | 2,845 | 2,961 | 2,843 | 2,922 | 3,222 | 3,280 | 3,419 | 3,140 | 3,141 | 3,161 | 3,304 | 3,268 |
| 2014 | 3,118 | 3,079 | 3,196 | 3,333 | 3,287 | 3,154 | 3,459 | 3,314 | 3,005 | 2,750 | 3,175 | 3,515 |
| 2015 | 3,212 | 3,239 | 3,273 | 3,316 | 3,239 | 3,373 | 3,422 | 3,328 | 3,296 | 3,249 | 3,382 | 3,406 |
| 2016 | 2,971 | 2,923 | 3,342 | 3,141 | 3,185 | 3,278 | 3,419 | 3,318 | 3,126 | 3,034 | 3,280 | 3,392 |
| 2017 | 3,207 | 3,240 | 3,299 | 3,387 | 3,478 | 3,470 | 3,479 | 3,007 | 2,084 | 3,290 | 3,534 | 3,450 |
| 2018 | 3,286 | 2,906 | 3,386 | 3,402 | 3,258 | 3,473 | 3,662 | 3,603 | 3,554 | 3,518 | 3,550 | 3,534 |
| 2019 | 3,338 | 3,186 | 3,328 | 3,237 | 3,295 | 3,477 | 3,486 | 3,447 | 3,068 | 3,016 | 3,347 | 3,453 |
| 2020 | 3,372 | 3,398 | 3,354 | 2,904 | 2,668 | 2,799 | 2,903 | 2,853 | 2,861 | 2,784 | 2,964 | 3,086 |
| 2021 | 3,006 | 1,798 | 2,565 | 3,236 | 3,288 | 3,363 | 3,301 | 3,320 | 3,240 | 3,099 | 3,338 | 3,376 |
| 2022 | 3,001 | 3,039 | 3,438 | 3,531 | 3,704 | 3,585 | 3,575 | 3,498 | 3,526 | 3,283 | 3,569 | 3,092 |
| 2023 | 3,171 | 3,214 | 3,401 | 3,531 | 3,617 | 3,621 | 3,600 | 3,472 | 3,512 | 3,344 | 3,503 | 3,736 |
| 2024 | 3,244 | |||||||||||
| - = No Data Reported; -- = Not Applicable; NA = Not Available; W = Withheld to avoid disclosure of individual company data. |
| Release Date: 3/29/2024 |
| Next Release Date: 4/30/2024 |