|
Download Data (XLS File) |
|
||||||||
|
||||||||
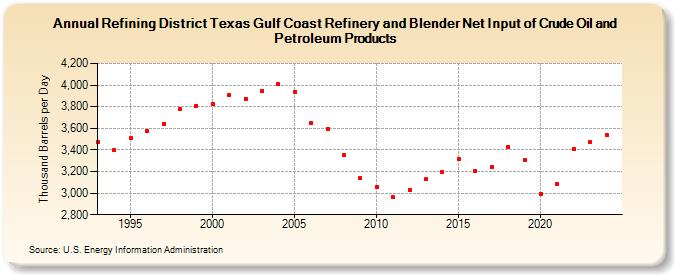
| Refining District Texas Gulf Coast Refinery and Blender Net Input of Crude Oil and Petroleum Products (Thousand Barrels per Day) | ||||||||
| Decade | Year-0 | Year-1 | Year-2 | Year-3 | Year-4 | Year-5 | Year-6 | Year-7 | Year-8 | Year-9 |
|---|---|---|---|---|---|---|---|---|---|---|
| 1990's | 3,472 | 3,397 | 3,506 | 3,574 | 3,641 | 3,781 | 3,809 | |||
| 2000's | 3,824 | 3,911 | 3,875 | 3,949 | 4,006 | 3,940 | 3,646 | 3,592 | 3,349 | 3,141 |
| 2010's | 3,057 | 2,961 | 3,030 | 3,126 | 3,200 | 3,312 | 3,202 | 3,245 | 3,431 | 3,308 |
| 2020's | 2,994 | 3,086 | 3,405 | 3,469 | 3,537 |
| - = No Data Reported; -- = Not Applicable; NA = Not Available; W = Withheld to avoid disclosure of individual company data. |
| Release Date: 6/30/2025 |
| Next Release Date: 8/29/2025 |