|
Download Data (XLS File) |
|
||||||||
|
||||||||
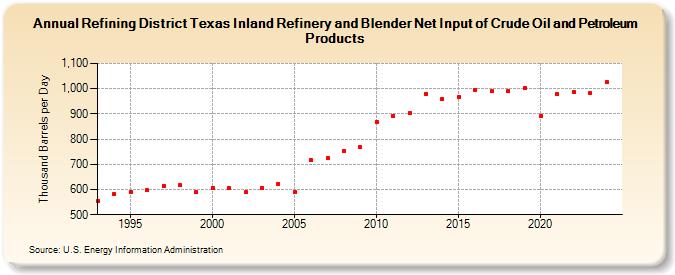
| Refining District Texas Inland Refinery and Blender Net Input of Crude Oil and Petroleum Products (Thousand Barrels per Day) | ||||||||
| Decade | Year-0 | Year-1 | Year-2 | Year-3 | Year-4 | Year-5 | Year-6 | Year-7 | Year-8 | Year-9 |
|---|---|---|---|---|---|---|---|---|---|---|
| 1990's | 556 | 582 | 589 | 597 | 614 | 616 | 589 | |||
| 2000's | 607 | 605 | 590 | 606 | 623 | 591 | 716 | 724 | 751 | 767 |
| 2010's | 869 | 893 | 904 | 978 | 960 | 969 | 996 | 989 | 990 | 1,001 |
| 2020's | 891 | 977 | 987 | 983 |
| - = No Data Reported; -- = Not Applicable; NA = Not Available; W = Withheld to avoid disclosure of individual company data. |
| Release Date: 3/29/2024 |
| Next Release Date: 8/30/2024 |