|
Download Data (XLS File) |
|
||||||||
|
||||||||
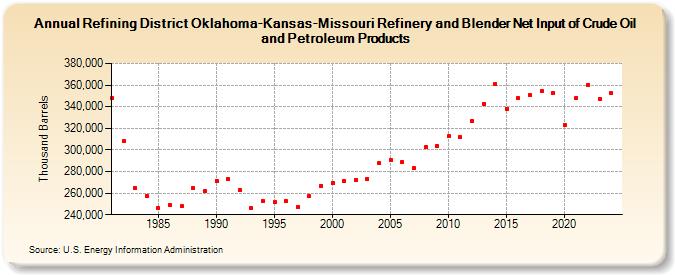
| Refining District Oklahoma-Kansas-Missouri Refinery and Blender Net Input of Crude Oil and Petroleum Products (Thousand Barrels) | ||||||||
| Decade | Year-0 | Year-1 | Year-2 | Year-3 | Year-4 | Year-5 | Year-6 | Year-7 | Year-8 | Year-9 |
|---|---|---|---|---|---|---|---|---|---|---|
| 1980's | 347,856 | 307,789 | 264,511 | 257,299 | 245,807 | 248,949 | 247,814 | 264,381 | 261,657 | |
| 1990's | 271,540 | 273,158 | 262,701 | 245,821 | 252,676 | 251,557 | 252,380 | 247,373 | 256,934 | 266,928 |
| 2000's | 269,527 | 271,384 | 272,302 | 273,029 | 287,819 | 291,030 | 288,898 | 283,121 | 302,618 | 303,600 |
| 2010's | 312,634 | 311,824 | 326,823 | 342,845 | 360,939 | 337,947 | 347,600 | 350,659 | 354,675 | 352,265 |
| 2020's | 322,885 | 348,149 | 360,511 | 347,134 |
| - = No Data Reported; -- = Not Applicable; NA = Not Available; W = Withheld to avoid disclosure of individual company data. |
| Release Date: 8/30/2024 |
| Next Release Date: 8/29/2025 |