|
Download Data (XLS File) |
|
||||||||
|
||||||||
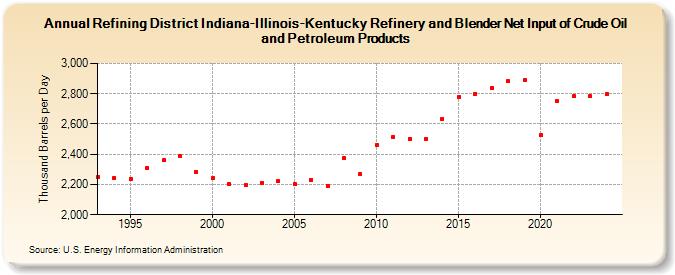
| Refining District Indiana-Illinois-Kentucky Refinery and Blender Net Input of Crude Oil and Petroleum Products (Thousand Barrels per Day) | ||||||||
| Decade | Year-0 | Year-1 | Year-2 | Year-3 | Year-4 | Year-5 | Year-6 | Year-7 | Year-8 | Year-9 |
|---|---|---|---|---|---|---|---|---|---|---|
| 1990's | 2,250 | 2,246 | 2,238 | 2,308 | 2,359 | 2,386 | 2,282 | |||
| 2000's | 2,242 | 2,201 | 2,198 | 2,212 | 2,220 | 2,200 | 2,231 | 2,193 | 2,374 | 2,267 |
| 2010's | 2,464 | 2,514 | 2,501 | 2,503 | 2,635 | 2,780 | 2,800 | 2,838 | 2,882 | 2,888 |
| 2020's | 2,527 | 2,749 | 2,784 | 2,784 |
| - = No Data Reported; -- = Not Applicable; NA = Not Available; W = Withheld to avoid disclosure of individual company data. |
| Release Date: 8/30/2024 |
| Next Release Date: 8/29/2025 |