|
Download Data (XLS File) |
|
||||||||
|
||||||||
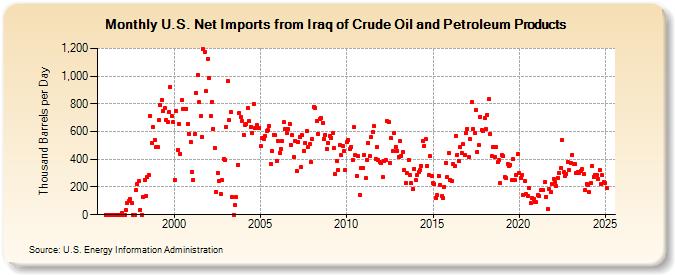
| U.S. Net Imports from Iraq of Crude Oil and Petroleum Products (Thousand Barrels per Day) | ||||||||
| Year | Jan | Feb | Mar | Apr | May | Jun | Jul | Aug | Sep | Oct | Nov | Dec |
|---|---|---|---|---|---|---|---|---|---|---|---|---|
| 1996 | 0 | 0 | 0 | 0 | 0 | 0 | 0 | 0 | 0 | 0 | 0 | 14 |
| 1997 | 0 | 0 | 35 | 84 | 102 | 115 | 88 | 0 | 0 | 177 | 220 | 240 |
| 1998 | 36 | 0 | 127 | 254 | 137 | 270 | 286 | 713 | 517 | 636 | 542 | 486 |
| 1999 | 485 | 681 | 791 | 829 | 750 | 773 | 680 | 672 | 741 | 922 | 713 | 668 |
| 2000 | 254 | 750 | 468 | 657 | 438 | 830 | 762 | 765 | 765 | 653 | 585 | 528 |
| 2001 | 310 | 253 | 579 | 880 | 1,011 | 810 | 710 | 563 | 1,192 | 1,177 | 889 | 1,126 |
| 2002 | 988 | 709 | 813 | 619 | 482 | 167 | 301 | 246 | 148 | 248 | 403 | 394 |
| 2003 | 634 | 963 | 681 | 739 | 128 | 0 | 67 | 125 | 362 | 735 | 706 | 678 |
| 2004 | 578 | 646 | 655 | 769 | 674 | 636 | 593 | 800 | 623 | 647 | 629 | 626 |
| 2005 | 493 | 551 | 548 | 569 | 604 | 608 | 642 | 369 | 459 | 577 | 572 | 390 |
| 2006 | 532 | 446 | 476 | 531 | 666 | 617 | 592 | 620 | 655 | 505 | 573 | 419 |
| 2007 | 531 | 314 | 523 | 562 | 341 | 573 | 460 | 520 | 603 | 490 | 508 | 378 |
| 2008 | 543 | 780 | 773 | 679 | 583 | 693 | 696 | 663 | 543 | 577 | 476 | 519 |
| 2009 | 568 | 554 | 587 | 484 | 295 | 390 | 321 | 500 | 428 | 499 | 461 | 325 |
| 2010 | 523 | 539 | 475 | 490 | 394 | 630 | 430 | 281 | 421 | 143 | 340 | 336 |
| 2011 | 433 | 263 | 398 | 519 | 422 | 559 | 596 | 637 | 404 | 490 | 395 | 380 |
| 2012 | 374 | 271 | 386 | 395 | 675 | 668 | 375 | 550 | 461 | 593 | 489 | 462 |
| 2013 | 419 | 529 | 426 | 455 | 320 | 228 | 299 | 397 | 287 | 226 | 182 | 332 |
| 2014 | 249 | 289 | 306 | 321 | 351 | 529 | 496 | 543 | 350 | 286 | 421 | 282 |
| 2015 | 227 | 222 | 121 | 139 | 282 | 214 | 133 | 117 | 203 | 375 | 269 | 447 |
| 2016 | 252 | 245 | 365 | 349 | 571 | 434 | 390 | 488 | 448 | 507 | 434 | 590 |
| 2017 | 622 | 413 | 543 | 810 | 619 | 587 | 756 | 456 | 502 | 708 | 611 | 605 |
| 2018 | 699 | 617 | 721 | 833 | 583 | 421 | 485 | 420 | 485 | 377 | 392 | 226 |
| 2019 | 429 | 422 | 275 | 265 | 366 | 355 | 360 | 249 | 400 | 252 | 283 | 436 |
| 2020 | 299 | 262 | 289 | 140 | 242 | 146 | 136 | 193 | 83 | 120 | 110 | 89 |
| 2021 | 89 | 140 | 135 | 175 | 178 | 180 | 237 | 131 | 40 | 185 | 165 | 223 |
| 2022 | 261 | 235 | 204 | 268 | 303 | 334 | 536 | 306 | 282 | 295 | 380 | 326 |
| 2023 | 370 | 434 | 368 | 365 | 303 | 311 | 303 | 319 | 328 | 294 | 178 | 223 |
| 2024 | 217 | 161 | 228 | 350 | ||||||||
| - = No Data Reported; -- = Not Applicable; NA = Not Available; W = Withheld to avoid disclosure of individual company data. |
| Release Date: 6/28/2024 |
| Next Release Date: 7/31/2024 |