|
Download Data (XLS File) |
|
||||||||
|
||||||||
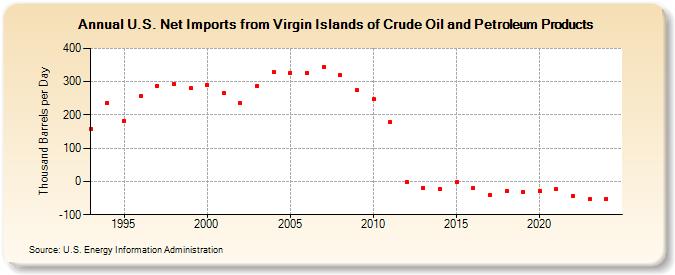
| U.S. Net Imports from Virgin Islands of Crude Oil and Petroleum Products (Thousand Barrels per Day) | ||||||||
| Decade | Year-0 | Year-1 | Year-2 | Year-3 | Year-4 | Year-5 | Year-6 | Year-7 | Year-8 | Year-9 |
|---|---|---|---|---|---|---|---|---|---|---|
| 1990's | 159 | 236 | 182 | 256 | 288 | 293 | 280 | |||
| 2000's | 290 | 267 | 235 | 287 | 330 | 327 | 327 | 345 | 320 | 274 |
| 2010's | 247 | 179 | -3 | -19 | -22 | -3 | -20 | -40 | -28 | -31 |
| 2020's | -29 | -24 | -43 | -55 |
| - = No Data Reported; -- = Not Applicable; NA = Not Available; W = Withheld to avoid disclosure of individual company data. |
| Release Date: 3/29/2024 |
| Next Release Date: 8/30/2024 |